Record market capitalization of the top 100 banks
- In Q3 25, global capital markets recorded significant price gains (MSCI World market cap +6.8% QoQ); the top 100 banks achieved a record market capitalization of EUR 8.2 trillion.
- With a TSR of +14.8% QoQ, Western European banks in particular stood out in a regional comparison (USA: +9.3% QoQ).
- Western European banks increased their price-to-book ratio to 1.20x in Q3 25, while US banks reached their highest level at 1.89x.
Transatlantic economy brightens slightly
- Germany recorded slight growth for the second quarter in a row in Q2 25 (+0.2% YoY); in contrast, Western Europe exceeded expectations with a growth figure of +1.5% YoY (US: +2.1% YoY).
- Following persistent inversion, the yield curve in the euro area rose steadily again in Q3 25 for the first time in a long while.
- The US dollar remains under pressure – US budget deficits, political uncertainty and weak growth are preventing a recovery against the euro.
- Interest rates for consumer and mortgage loans initially rose slightly in Q2 25 but fell again after the ECB cut interest rates in June.
Western European banks continue to boost the top 100
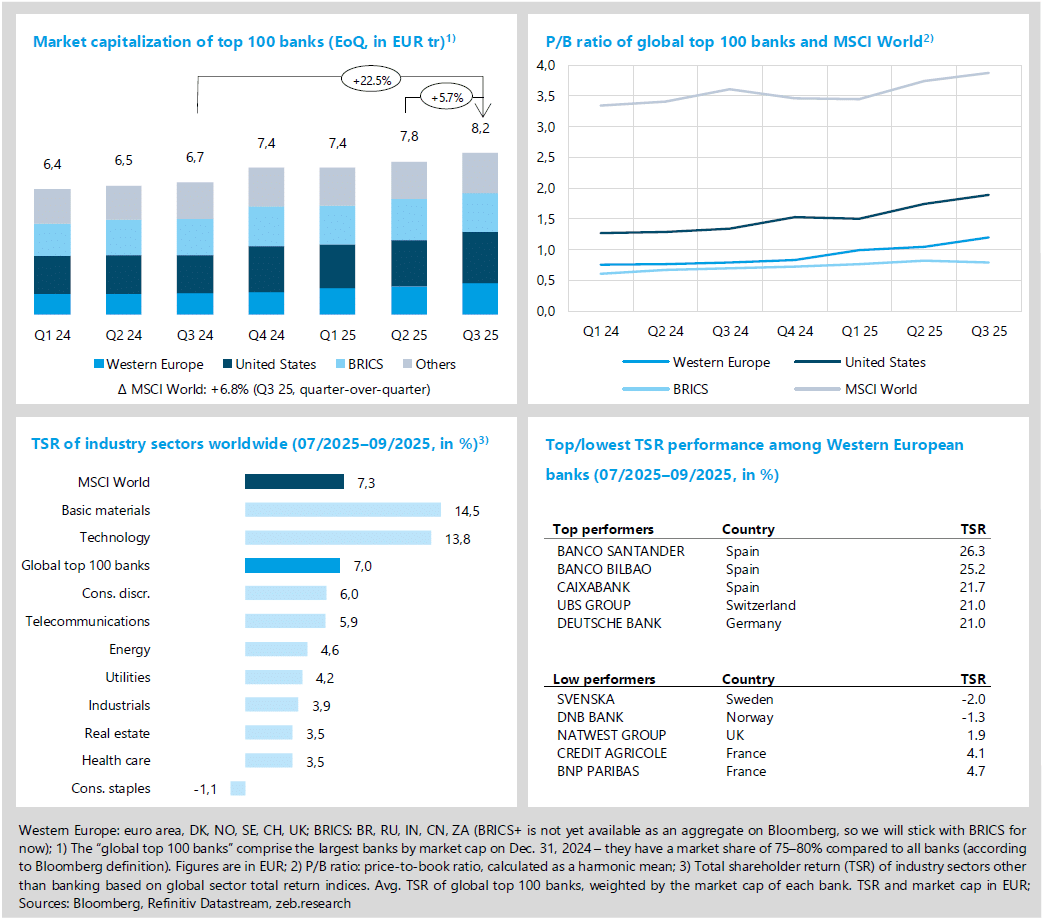
Driven by an overall stable market environment with signs of the US Federal Reserve beginning a cycle of interest rate cuts, global capital markets performed well in Q3 25 (MSCI World market cap +6.8% QoQ, TSR +7.3% QoQ). Progress in resolving trade conflicts – including agreements between the US and both Japan and the EU – also provided support, as did renewed strong impetus from the technology sector. The picture was similarly positive for the global top 100 banks (market cap +5.7% QoQ, TSR +7.0% QoQ). With a TSR of +14.8% QoQ, Western European banks once again took the lead in a regional comparison (US banks: +9.3% TSR QoQ). Compared to the previous year, they increased their market capitalization by 44.6% (US banks: +33.3% YoY).
- In Q3 25 Western European banks stabilized their price-to-book ratio above the 1.0 mark and even increased it further (+0.16x QoQ to 1.20x). US banks also performed well, achieving +0.15x QoQ to 1.89x, the highest level since zeb.market.flash was launched in spring 2012.
- Among sectors, in Q3 25, basic materials achieved the best performance with a TSR of +14.5% QoQ, supported by higher commodity prices and rising demand for industrial metals in the context of global infrastructure development programs. The consumer staples sector was the weakest performer (TSR ‑1% QoQ) as high costs and growing price sensitivity among consumers weighed on margins.
- With a TSR of +26.3% QoQ, Banco Santander topped the individual bank rankings in Q3 25, buoyed by record profits in Q2 and the announcement of its share buyback program. At the bottom of the ranking is Svenska Handelsbanken (TSR -2.0% QoQ), whose performance suffered from declining net profits and increasing earnings pressure following interest rate cuts by the Swedish central bank.
Slight economic upturn on both sides of the Atlantic
Germany has been recording slightly positive growth again since the beginning of the year (+0.2% YoY in both Q1 and Q2 25). However, a revision of the data by the Federal Statistical Office showed that the recession in the two previous years was more severe than initially reported (-0.9% instead of -0.3% in 2023 and -0.5% instead of -0.2% in 2024). For Western Europe, the economic outlook has brightened: GDP growth in Q2 25 was +1.5% YoY and thus +0.4%p above the expectations of three months ago, driven primarily by strong performance in Spain and France. In the US, economic output reached +2.1% YoY in Q2 25, with the Fed cutting its key interest rate in September for the first time this year – by 25bp to 4.25%. Meanwhile, the conflict between President Trump and Fed Chairman Powell continues. Most recently, Trump faced a setback – the Supreme Court blocked his attempt to dismiss Fed Governor Cook.
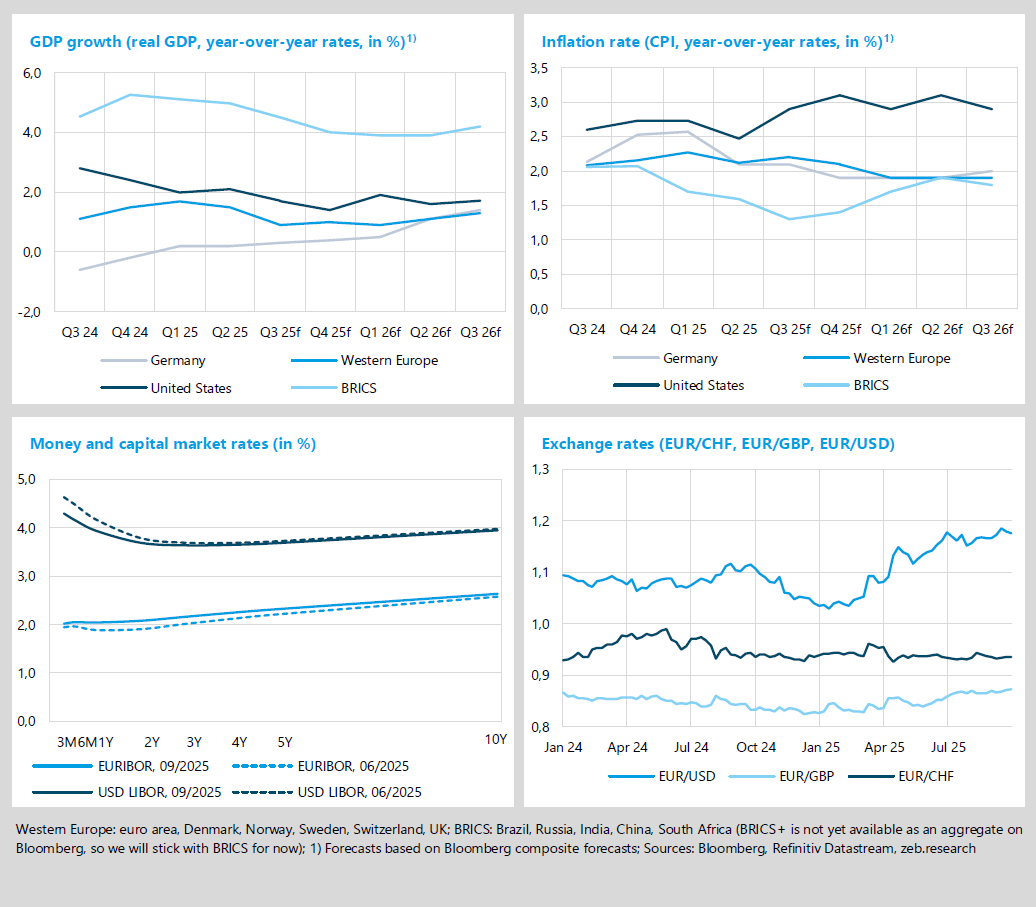
- For Q3 25, analysts expect inflation in Western Europe to rise slightly by +0.1pp to 2.2% YoY (DE: 2.1% YoY). In 2026, inflation is likely to fall below the ECB’s 2.0% target rate for the first time since 2021.
- The ECB paused its cycle of interest rate cuts in Q3 25 and left the deposit rate at 2.0%. With inflation rising in the euro area, the yield curve shifted slightly upwards in parallel; it is noteworthy that the long-standing inversion – a situation where short-term interest rates are higher than long-term interest rates – reversed for the first time, giving way to a consistent upward trend. In the US, only the short end of the yield curve reacted to the Fed’s cut. In view of improving economic forecasts, volatile labor markets, persistent inflation and political pressure, monetary policy developments remain volatile.
- The US dollar remains under pressure due to high US budget deficits, political uncertainties and moderate growth prospects. Despite a temporary recovery at the beginning of Q3 25 in the wake of the tariff agreement with Japan, the exchange rate against the euro remained unchanged.
With a return on equity (ROE) of 14% once again, Western European banks maintained their top position in the ranking of regions in Q2 25. Supported by stable interest and commission income and a solid capital base, these banks continued to perform strongly despite ongoing global geopolitical tensions and the persistent macroeconomic uncertainty. US banks recorded a decline in ROE of -1.6 percentage points QoQ to 11.7% in Q2 25 (BRICS: -0.8 percentage points to 10.7%). This drop was primarily due to the negative result at Capital One, where the acquisition of competitor Discover Financial Services led to elevated provision expenses during the quarter.
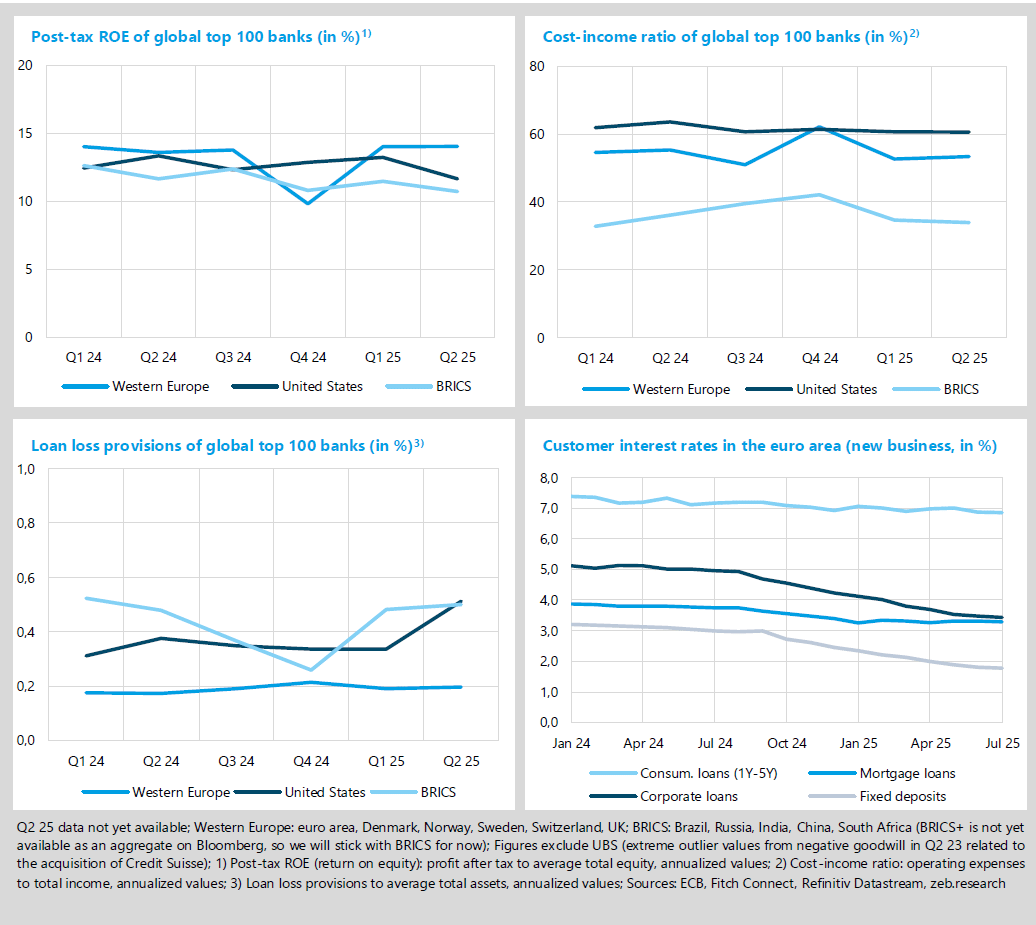
- Western European banks recorded a slight increase in their cost-income ratio (CIR) of +0.6 percentage points QoQ to 4% in Q2 25. The cost discipline achieved (-3.0% QoQ) was overshadowed by the decline in income (-4.0% QoQ). US banks saw only a marginal change in their CIR of -0.1 percentage points QoQ to 60.7% (BRICS: -0.6 percentage points to 34.0%).
- While Western European banks increased their risk provisions only marginally by +1bp QoQ in Q225, US banks recorded a significant increase of +17bp QoQ (BRICS: +2bp QoQ). This increase was mainly due to Capital One’s acquisition of Discover Financial Services. Higher provisions were necessary because of fair value adjustments to acquired loans and the harmonization of risk models. There was no actual deterioration in credit quality in Q2 25.
- In Q2 25, interest rates for consumer and mortgage loans rose slightly at first before falling again in the wake of the ECB’s interest rate cut in June. In the consumer loan business, stricter guidelines had a dampening effect on the supply of credit. In the corporate loan business, weak demand led to a noticeable decline in interest rates.