Robust capital markets despite high volatility
- The global capital markets improved slightly in a turbulent Q2 25 (MSCI World market cap. +1.7% QoQ, TSR +2.7% QoQ) – for the top 100 banks, it was a sol-id quarter overall (market cap. +4.6% QoQ, TSR +4.8% QoQ).
- Western European banks were able to further increase their price-to-book ra-tio in Q2 25 (+0.06x QoQ to 1.05x) owing to a strong capital market perfor-mance.
- After a weak previous quarter, high profits catapulted the technology sector back to the top of the industry ranking in Q2 25 (TSR +13.1% QoQ).
Tariff conflict dampens macroeconomic outlook
- Germany recorded zero growth in Q1 25, while the tariff conflict has clearly dampened the outlook for the USA (GDP Q4 25f: +1.0%) and Western Europe (GDP Q4 25f: +0.8%).
- The euro continued its upward trend against the US dollar in Q2 25 and gained a further +9% QoQ.
- Western European banks reduced their risk provisioning by -2 bp QoQ in Q1 25 – the future positioning remains in focus in light of global uncertainties.
- The short-term trend of slightly rising mortgage rates was directly broken as a result of expected ECB interest rate cuts in April.
Solid capital market performance masks a turbulent quarter
In Q2 25, the global capital markets experienced a mild upward trend (MSCI World market cap. +1.7% QoQ, TSR +2.7% QoQ). The trade conflict initiated by the USA lost much of its intensity over the course of the quarter in the wake of a cautious rapprochement with China. Initially, the announced tariffs caused prices to fall considerably. The war between Israel and Iran has (so far) had no lasting impact on the financial markets either – at the end of the quarter, the oil price was even trading below its starting value. Q2 25 was a good quarter for the global top 100 banks (market cap +4.6% QoQ, TSR +4.8% QoQ), driven in particular by US and Western European institutions. While US banks (TSR +7.7% QoQ) compensated for their weak previous quarter, the price gains of Western European banks (TSR +7.7% QoQ) reflected an overall successful first half of the year with high income.
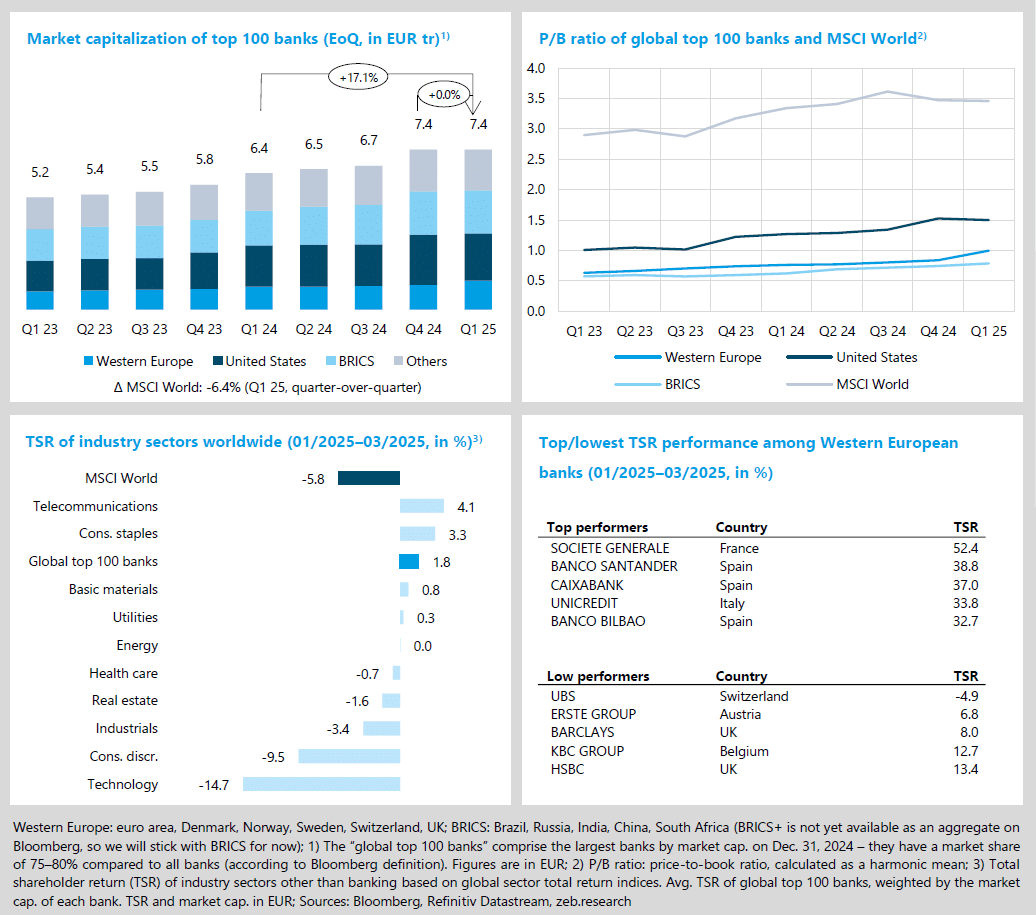
- As part of their renewed strong capital market performance in Q2 25, Western European banks were able to further increase their price-to-book ratio (+0.06x QoQ to 1.05x); US banks recorded their strongest increase in around four years (+0.24x QoQ to 1.74x) as a result of their race to catch up.
- High quarterly profits and signs of reassurance in the tariff conflict put the technology sector in the lead in Q2 25 with a TSR of +13.1% QoQ. Second place went to the global top 100 banks (TSR +4.8% QoQ). Among the industries, the health care sector took last place with Trump’s plans for radical drug price cuts in the USA as the main driver here (TSR -9.9% QoQ).
- With a TSR of +19.9% QoQ, Société Générale once again got first place in the Q2 25 performance ranking. The stock price benefited from the strategic reorganization, which aims to reduce peripheral business, bolster the balance sheet and increase dividends. Finishing in last place: HSBC (TSR 0.6% QoQ), whose quarterly profits fell sharply. Nevertheless, they announced large stock buy-backs.
Trade conflict leaves macroeconomic marks
Germany narrowly escaped further negative growth in Q1 25 (+0.0% YoY), whereas the economic output in Western Europe (+1.6% YoY) and the USA (+2.0% YoY) grew moderately. Analysts do not expect Germany to grow by more than 1% again until mid-2026, with the investment package adopted in March likely to provide an economic boost. However, in view of the trade conflict and (geo)political conflicts, expectations for the rest of the year are dampened. The same applies to Western Europe. In the USA, the expected GDP growth rate will fall to 1.0% by the end of the year while inflation is expected to rise (Q4 25f: 3.3%). Due to the disinflation trend that has been interrupted since the beginning of the year, the US Federal Reserve remains reluctant to make interest rate moves – despite this, the markets expect a reduction of 75 bp by the end of the year.
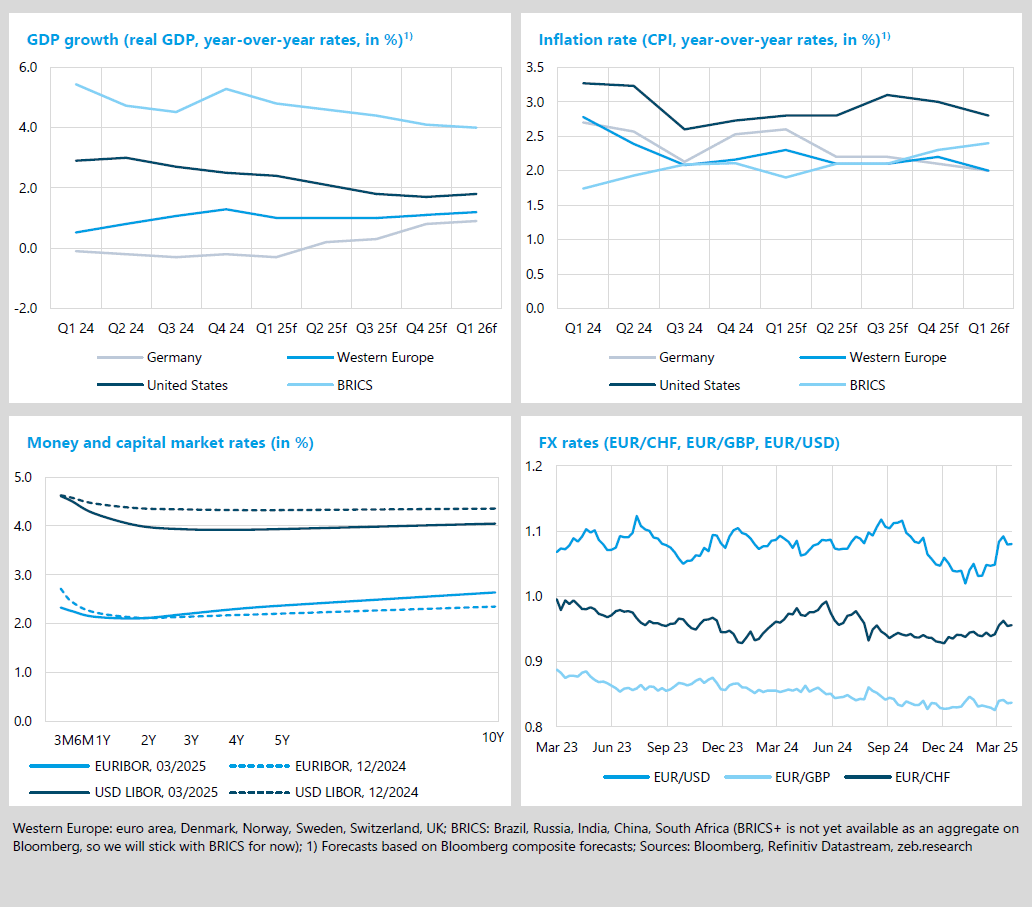
- In Q2 25, the inflation rate in Germany is expected to fall by -0.5%p to 2.1% (Western Europe: -0.2%p to 2.1% YoY) and is therefore close to reaching the target inflation rate of 2.0%.
- The ECB lowered the deposit rate again in Q2 25 by a total of 50 bp, thereby making the yield curve even steeper. Analysts expect at least one further interest rate cut by the end of the year, which could result in the deposit rate settling between 1.5% and 1.75%. While the very short end of the US yield curve remains untouched due to the Federal Reserve’s hesitation regarding interest rate moves, the first signs of normalization are emerging at the long end – for the first time since Q2 22, 10-year rates have again exceeded 2-year rates.
- The euro continued its upward momentum against the US dollar in Q2 25, gaining a further +9% QoQ to an exchange rate of 1.17 – the highest rate in four years. The erratic US tariffs policy has favored capital outflows from the USA and strengthened the euro as a safe-haven currency.
Following a decline in ROE in Q4 24 due to one-off effects, in Q1 25, Western European banks regained the top position in the regions’ ROE ranking. The increase in return on equity by +4.2%p QoQ to 14.0% was supported by stable net interest income as well as robust net commission income and con-tinued high credit quality – despite the uncertain economic environment. However, the ROE remained unchanged compared to the same quarter of the previous year, despite a moderate increase in profits. In contrast, US institutions recorded an increase in ROE of +0.4%p QoQ to 13.2% (BRICS: +0.7%p QoQ to 11.3%), which was driven by profit growth of +1.7% QoQ – supported in particular by solid non-interest income in Q1 25.
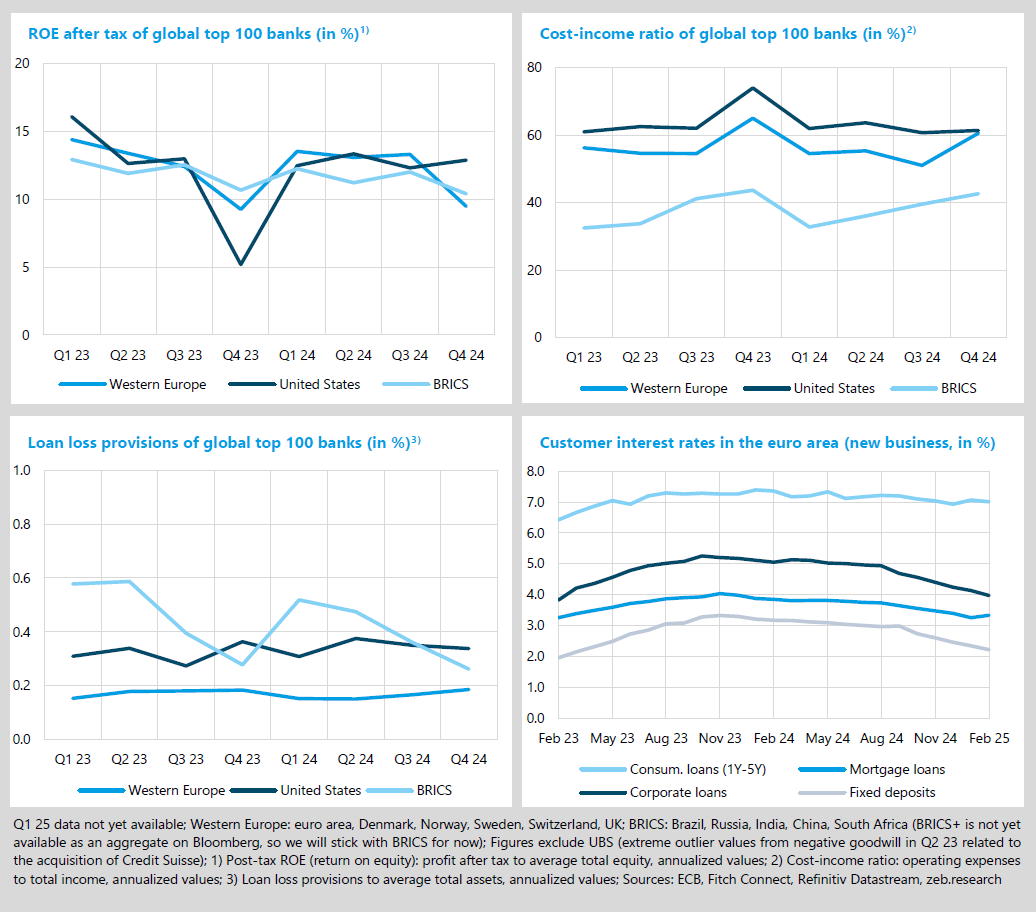
- Banks in all regions under review were able to improve their cost-income ratio (CIR) in Q1 25 as the cost level fell across the board. Due to the absence of the one-off effects from Q4 24, Western Euro-pean banks recorded the most significant improvement in their CIR by a total of -9.4%p QoQ to 52.8% (USA: -0.7%p QoQ to 60.7%, BRICS: -7.7%p QoQ to 34.7%) despite a slight decline in income of 0.9% QoQ.
- Western European banks reduced their risk provisioning slightly by -2 bp QoQ in Q1 25 in view of a low level of non-performing loans (US banks: +0 bp QoQ; BRICS: +23 bp QoQ). In light of global un-certainties and macroeconomic impacts, the institutions’ reaction with regard to their risk provision-ing in the coming quarters must be subject to careful scrutiny.
- While other customer interest rates in the euro area continued to fall in Q1 25, interest rates for mortgage loans rose slightly at first as a result of the adopted German borrowing package. Since US tariff announcements shook the stock markets, markets ultimately expected the ECB to cut interest rates, which directly broke the trend of rising mortgage rates in April.