Why is the traditional, intuitive definition of peer groups often inadequate?
When it comes to comparing competitors in practice, we often find that peer groups are or have so far been defined quite arbitrarily – often based on market expertise or gut feeling. The defined peer groups also tend to remain constant for years without changes to the business models being analyzed objectively. So we asked ourselves: Are the defined peers actually (still) structurally similar to the bank analyzing its competition? Or do we sometimes compare apples to oranges?
We wanted to find out which banks really have similar business models – objectively and reproducibly. Our aim was not to criticize current practice. Rather, we wanted to develop a data-driven methodology to generate further insights when defining peer groups. Ultimately, users and creators of peer group comparisons must decide who should be compared with whom. Our method may provide additional input.
By using objectifiable measures, we may be able to avoid a core problem of exclusively experience-based peer group analysis. People tend to focus too much on their own experience. As a result, they may overlook significant developments or fail to recognize past misjudgments. In addition, different stakeholders also put together different peer groups: The peer groups considered by management teams are not always the same as those used by equity analysts.
Our aim was to help derive a kind of objective, data-driven peer landscape of the European banking sector. Specifically, we intended to find a way to help identify peers by means of data – and thus disconnected from any hidden agendas. We wanted to show that it is possible to identify structures on a quantitative basis – without making assumptions based on experience. The aim was to form robust clusters that reflect real structural proximity: who is actually similar to whom when considering financial KPIs and balance sheet structures?
This is a very common question in our work as management consultants at zeb, and so far our answers have tended to be rather heuristic. An idea for the future would be to make the methodology available to all our colleagues and clients within a user-friendly tool to support them in their work and in peer group selection.
Data basis: which KPIs are used?
In data-driven analyses, data selection is obviously crucial. For this initial analysis, we decided to look at the 50 leading European banks and selected five essential KPIs that reflect the structure and business model of a bank well: total assets, shares of customer loans and deposits, RWA density and the ratio of non-performing loans to gross loans. These key figures are broad enough to cover different types of banks, but specific enough to differentiate structures.
We deliberately focused on a small number of KPIs. Our goal was to avoid using too many dimensions so as not to create “noise” due to overlapping or redundant key figures.
These five KPIs illustrate the crucial differences: balance sheet size, customer orientation, risk exposure and stability. They already explain surprisingly much. Technically, however, the methodology works equally well for 15 key figures. And of course it also works for smaller, regionally operating institutions.
Wouldn’t it be exciting if, for example, the benchmarking of regional banks in Germany focused less on regional comparability and more on structural comparability?
Approach: How is the structural similarity of banks represented mathematically?
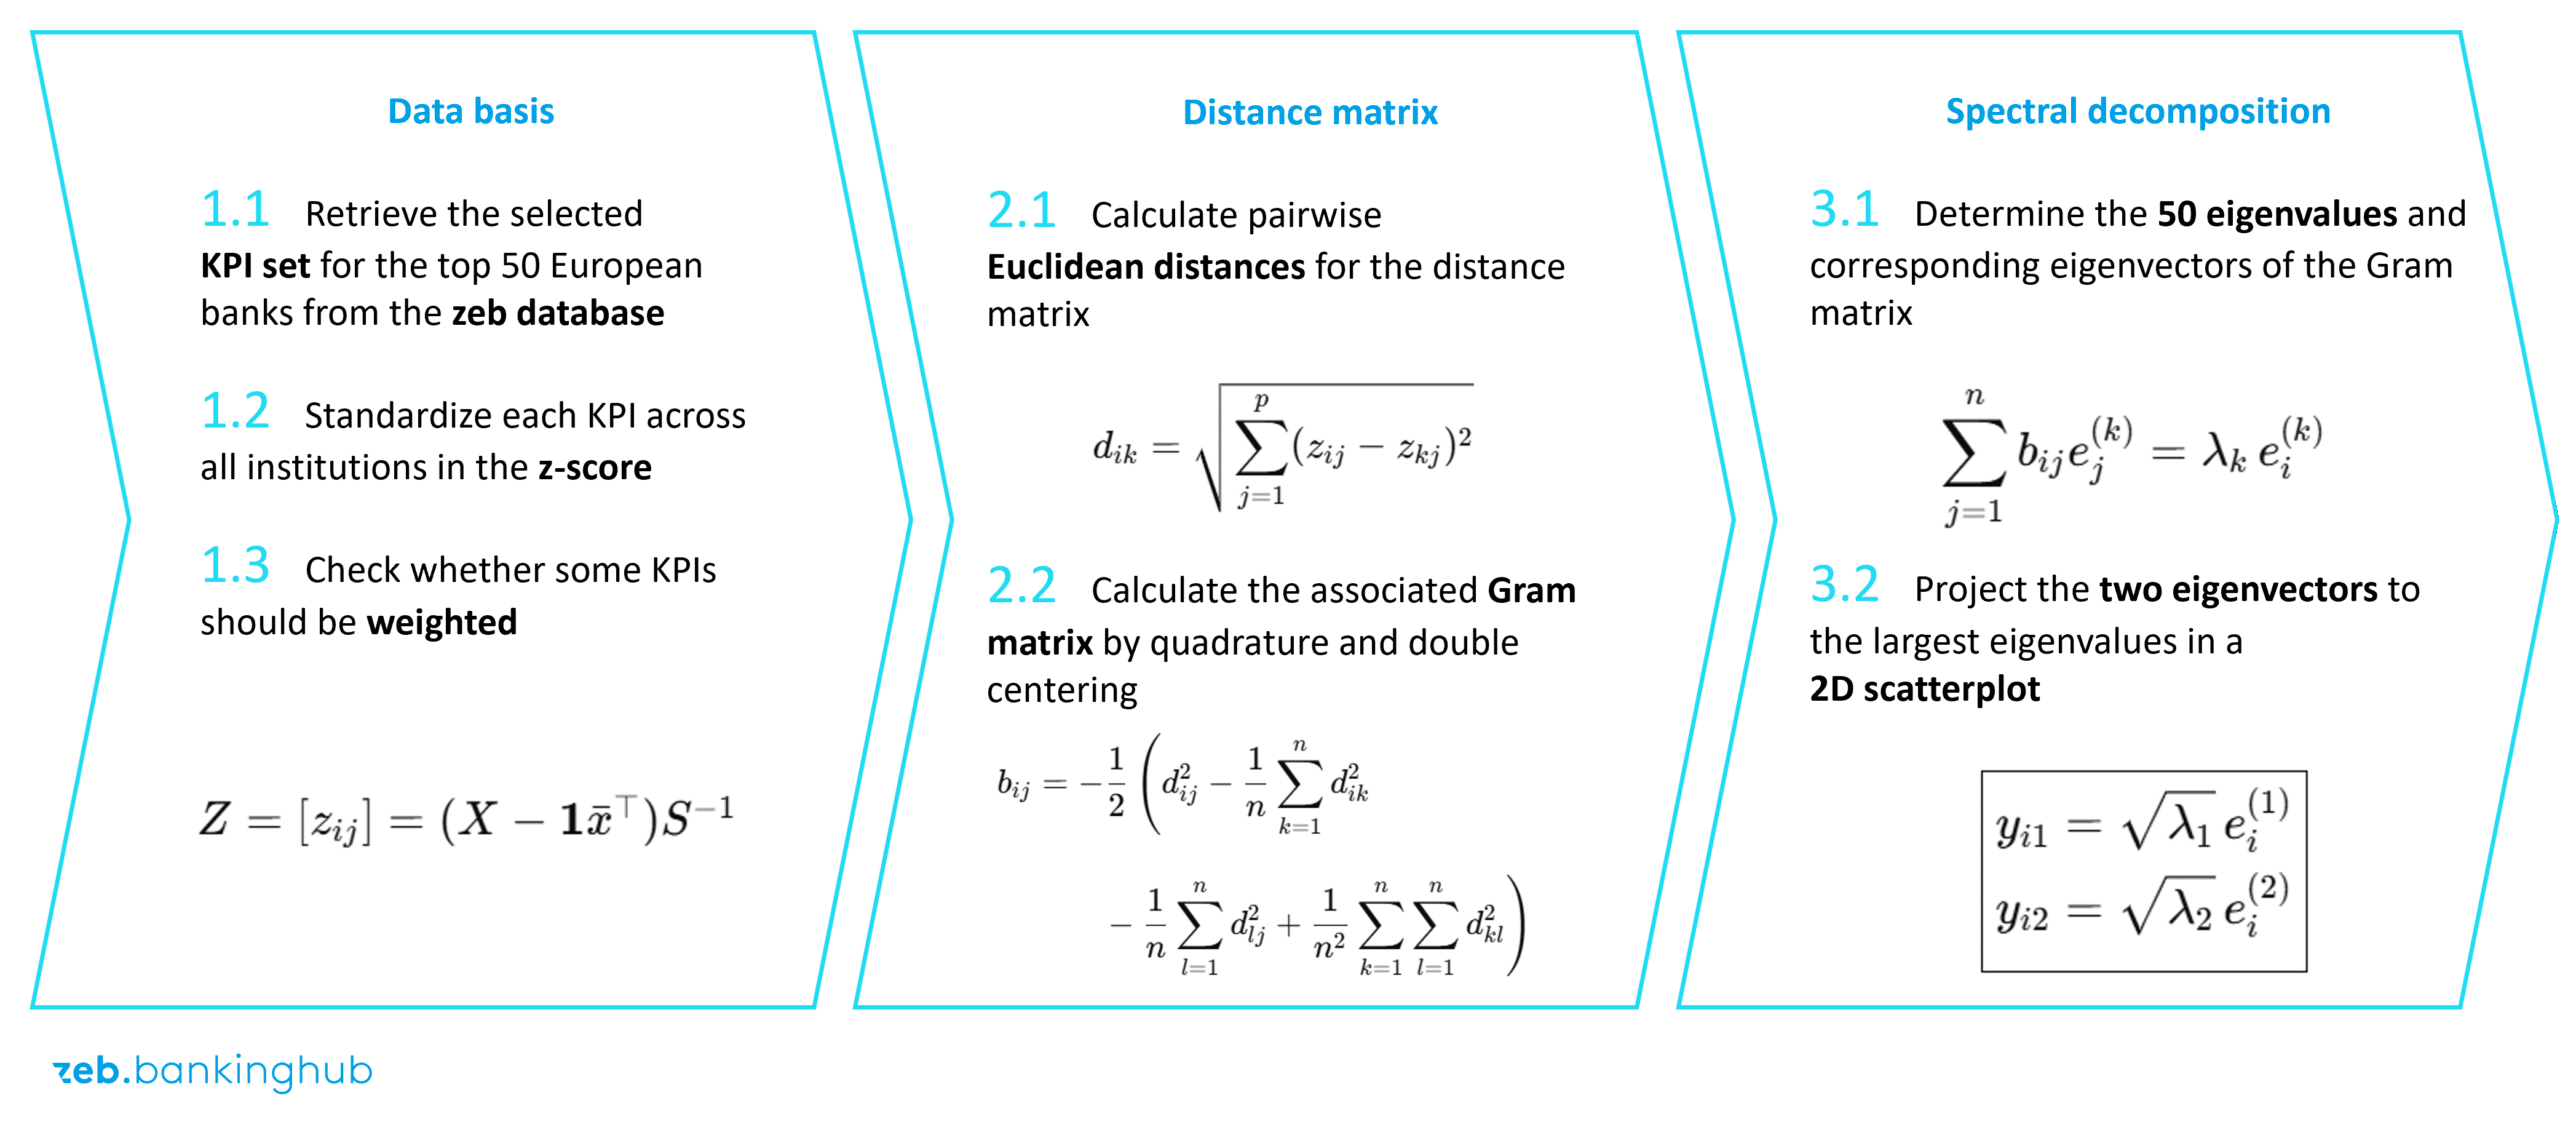
In the method we have developed for deriving peer groups, we use the concept of Euclidean distance measurement. This may sound complex to readers who are less familiar with mathematics. In fact, however, the method is not new and was introduced a long time ago. Imagine each bank as a point in multidimensional space – each axis corresponds to a key figure.
Two banks with similar values in all dimensions are close to each other; two with very different values are far apart. This distance in space is measured using the Euclidean distance, i.e. the “straight line” between the points. Small distances mean high structural similarity, large distances show divergences. The following is an anonymized graphical representation of these divergences.
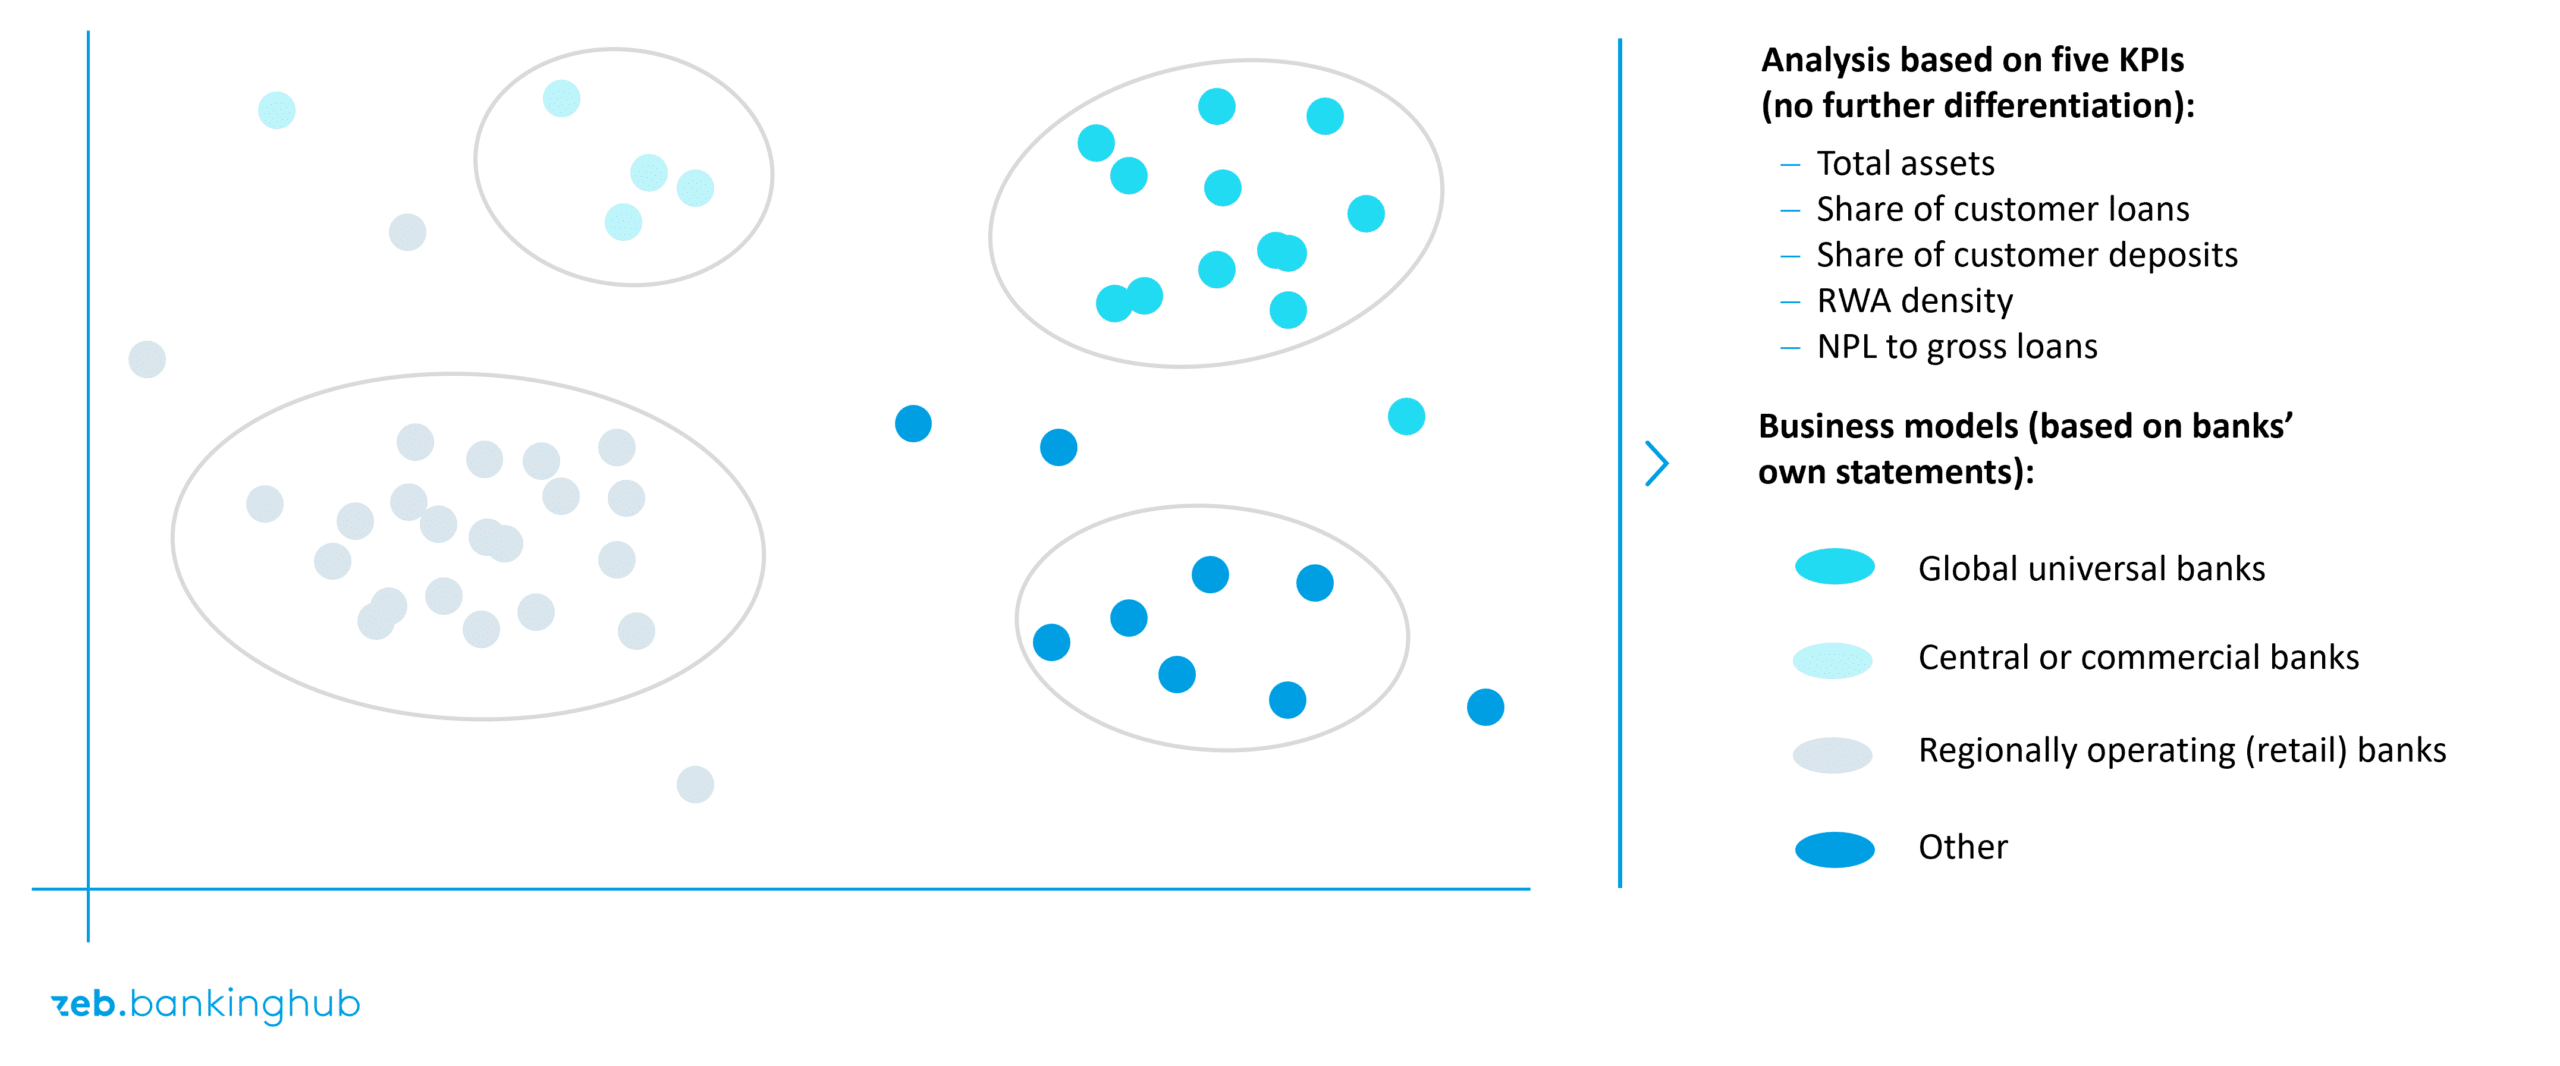
Attentive readers will recognize that the results are displayed in a two-dimensional cluster plot. This begs the question of how to get from a high-dimensional space to this plane representation. Here, too, we apply a method that has been in use for a long time.
The reduction to two dimensions takes place by means of so-called metric multidimensional scaling (MDS). It takes the distance matrix from the n-dimensional space (here n = 5) and projects it into two dimensions in such a way that the distances between the points are preserved as well as possible. Mathematically, this is based on an eigenvalue decomposition of the transformed Gram matrix – in other words, a bit of linear algebra. It serves to make the complex interrelationships visually apparent. This is easier to illustrate than it sounds: imagine, for example, that you only know the distances between the ten largest German cities – but not their actual geographical coordinates. Nevertheless, the relative position of all these cities to each other can be clearly reconstructed using these distances, except for the rotation and mirroring of the entire map. This is precisely the idea behind the MDS for banks, because the dimension of the space in which Euclidean distances are defined is completely irrelevant.
We believe that the special feature of our method lies in this application of advanced linear algebra. In the first-person view being simple to compute, you ask: who are the nearest neighbors in the given space? You don’t need a complete map or advanced math – the distances are enough to determine who you are most similar to.
In the new third-person perspective, however, we see the entire field from above – from a bird’s eye view, so to speak – although this would not be immediately feasible in view of the high-dimensional space. We look at the position of all banks relative to each other, recognizing clusters, transitions and distances. Both perspectives complement each other: the first is practical for concrete comparisons, the second is analytically helpful for the big picture.
What limitations must be kept in mind when interpreting the results?
We applied the methodology to the dataset and compared it with typical peer analyses. The results from mathematics and the typical peer group clusters used in practice largely confirmed each other in this setup. On the one hand, this surprised us. Of course, you would expect the business models to be evaluated correctly by practitioners. But the clarity with which clusters emerge was impressive. This speaks for the robustness of the approach. In addition, within the clusters we have the specific arrangement of the respective institutions in a two-dimensional space, which makes interpretation much easier.
Obviously, the limits of the chosen methodology must always be kept in mind. We would like to mention two main points here: Firstly, Euclidean distance measures purely linear relationships. Non-linear differences, such as those caused by qualitative business model factors, are not fully captured. Secondly, the result depends heavily on the scaling and weighting of the key figures – so methodological care is required. The method does not replace expert judgment, it complements it quantitatively.
What added value does the data-driven method offer analysts, banks and supervisory authorities?
Our method can be used to ensure that nothing is overlooked in the peer group analysis and that “groupthink” does not become a factor, as is so often the case. If peer groups that have already been selected are confirmed by the math, so much the better. Specifically, we see the following additional value of our method:
- It gives analysts and investors an objective basis for defining peer groups.
- It provides banks with valuable information on their positioning: who are we really comparable to?
- It can help supervisory authorities and central banks to identify structural clusters and systemic risks – beyond country categories.
The team of authors is available for questions, comments and detailed discussions on this method.