Banks regain market confidence in Q2 2023
+8.9% QoQ TSR performance of Western European banks
- Global top 100 banks regained market confidence in Q2 23, thus recovering from the decrease in market capitalisation in the previous quarter.
- Although hit hardest by the banking turmoil, the recovery of U.S. banks (TSR +3.9% QoQ) was near par with the global top 100 banks (TSR +4.2% QoQ).
After the collapses of Silicon Valley Bank and Credit Suisse in March 2023 had triggered turmoil in the banking world, markets picked up again in Q2 23 – both the banking sector and global capital markets (MSCI World TSR +6.6% QoQ, market capitalisation +5.5% QoQ). The major driver for the recovery of the global top 100 banks (TSR +4.2% QoQ) were Western European banks (+8.9% QoQ). In the U.S., market confidence in banks is returning more hesitantly (TSR +3.9% QoQ). The loss of confidence has particularly affected U.S. regional banks, which have been hit hard by customer churn. The loss of confidence may partly be explained by the comparatively lax regulation of regional banks in the U.S. – see this issue’s special topic on regulatory differences between the U.S. and the euro area in chapter 3 for a more detailed analysis.
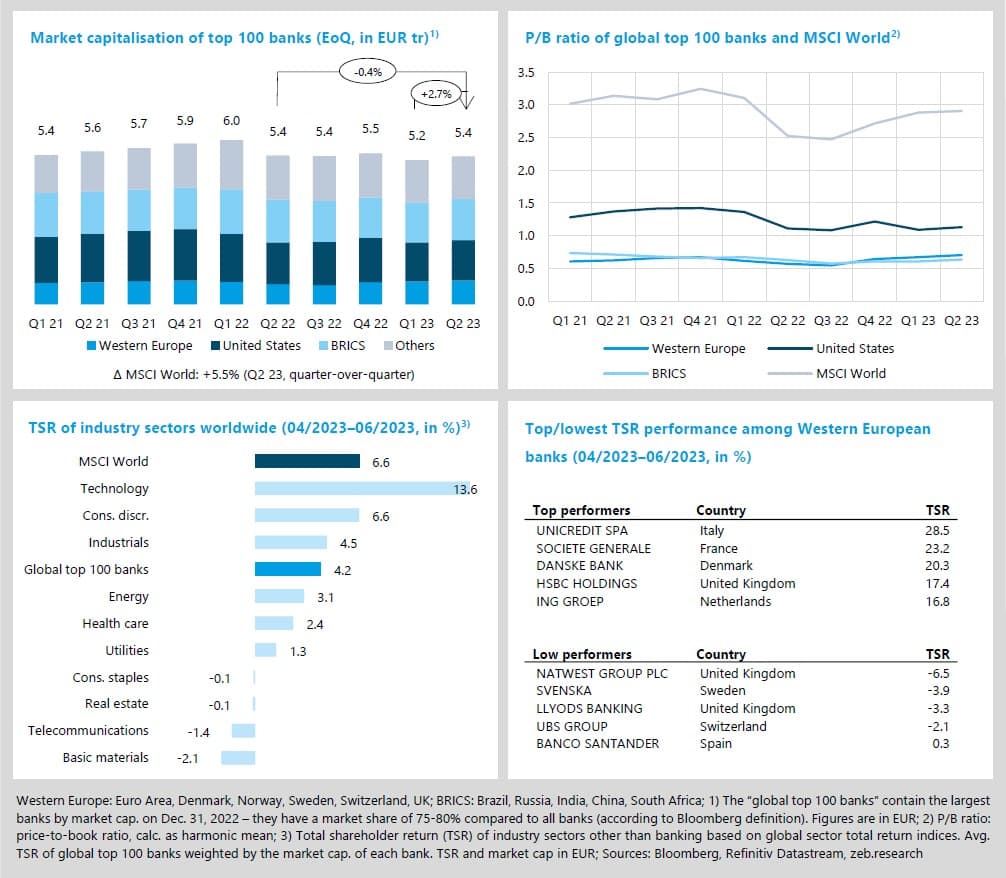
- Market capitalisation of the global top 100 banks rose to EUR 5.4 tr in Q2 23 (+2.7% QoQ), almost reaching the level before the banking turmoil in Q1 23. Even though the previous decline in market capitalisation was mainly caused by U.S. banks, Western European banks were the essential driver of the recovery in market capitalisation in Q2 23 (+4.4% QoQ, U.S.: +2.9% QoQ, BRICS: +2.9% QoQ).
- In Q2 23, the technology sector again exhibited the best TSR performance (+13.6% QoQ) among all industry sectors. Technology stocks keep profiting from market expectations of central banks’ interest rate hikes coming to an end as well as the market’s current enthusiasm for artificial intelligence.
- Raising its full-year profit forecast to more than EUR 6.5 bn, UniCredit continues its success story and ends the third consecutive quarter as the top performer among European banks with a TSR of +28.5% QoQ in Q2 23. The lowest performer in Q2 23 is NatWest (TSR -6.5%), for which forecasts suggest underwhelming long-term earnings despite the latest interest hikes and high current profits.
Bleak economic outlook keeps pressure on central banks high
-0.3% YoY real GDP growth in Q2 2023 in Germany
- While GDP forecasts for Western Europe and the U.S. improved slightly, a recession is now expected for Germany in 2023, contrasting previous estimates.
- High inflation rates in Germany (6.9% YoY) and Western Europe (5.9% YoY) remain sticky in Q2 23, keeping up the pressure on the ECB.
In Western Europe and the U.S., growth rates are expected to remain low in the upcoming quarters. In particular, the outlook for Germany has deteriorated significantly. Following negative economic growth in Q1 23 (-0.5% YoY), analysts expect GDP to decline in the two subsequent quarters as well, leading to a recession in Germany. The current economic outlook therefore increases the pressure on central banks to return to less restrictive monetary policies. Added to this is the pressure arising from the risks of the historically sharp interest rate rises in the last year, highlighted by the U.S. bank failures. What may be overcome by regulatory adjustments in the medium term poses another challenge – especially for the FED – in the short term. On top, inflation rates remain unacceptably high in Western Europe (5.9% YoY) and the U.S. (4.0% YoY) in Q2 23, exacerbating the central banks’ double bind.
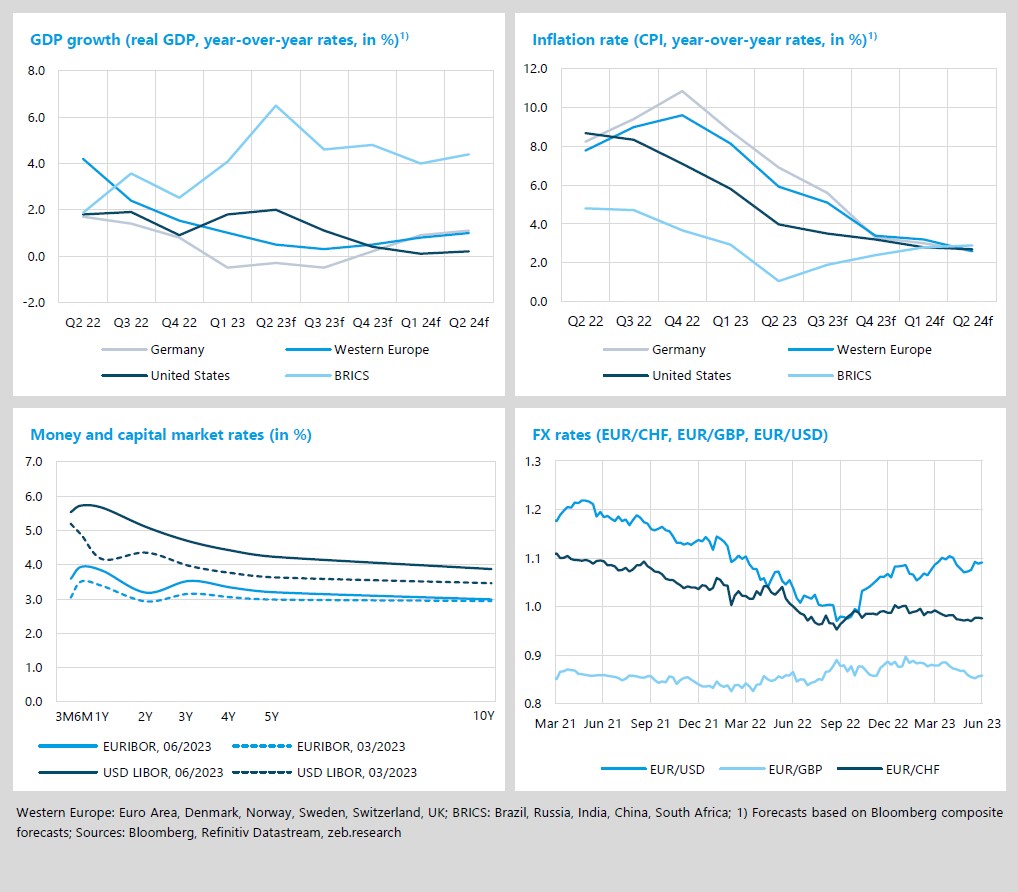
- Economic growth in Western Europe in Q2 23 (+0.5% YoY) has slightly improved compared with the previous quarter’s forecast (+0.0% YoY). Yet, current estimates expect growth rates of less than 1% for the remaining year. The expected growth rates for the BRICS group persist well above the level of Western Europe and the U.S. and show an expected spike for Q2 23 (+6.5% YoY).
- In Q2 23, inflation remains sticky in Western Europe (6.9% YoY) and the U.S. (4.0% YoY), while the BRICS group exhibited inflation below 2% for the first time in more than two years (1.1% YoY).
- The EUR/GBP FX rate fell below 0.86 in Q2 23, indicating market expectations that the Bank of England’s future monetary policy will become more hawkish compared with the ECB’s. Against the U.S. dollar, the euro ended the quarter at a similar level as at the beginning, but a temporary depreciation resulted from the uncertain U.S. debt ceiling negotiations.
In Q1 23, Western European banks managed to enhance profitability by +5.3%p YoY and +3.3%p QoQ. Although U.S. banks also saw a significant increase in ROE (+1.6%p YoY, +2.7%p QoQ), they were unable to prevent something unprecedented in the eleven-year-old history of the market flash: with an average ROE of 13.8%, Western European banks surpassed U.S. banks (13.4%) in Q1 23. While the overall performance of Western European banks in Q1 23 was already good, the main driver for the beat was HSBC’s +121% QoQ and +228% YoY increase in its net income, which alone contributed +1.8%p to the average ROE. An already very good performance of HSBC was further aided by an accounting driven reclassification of the French retail business and a significant provisional gain on the acquisition of SVB UK.
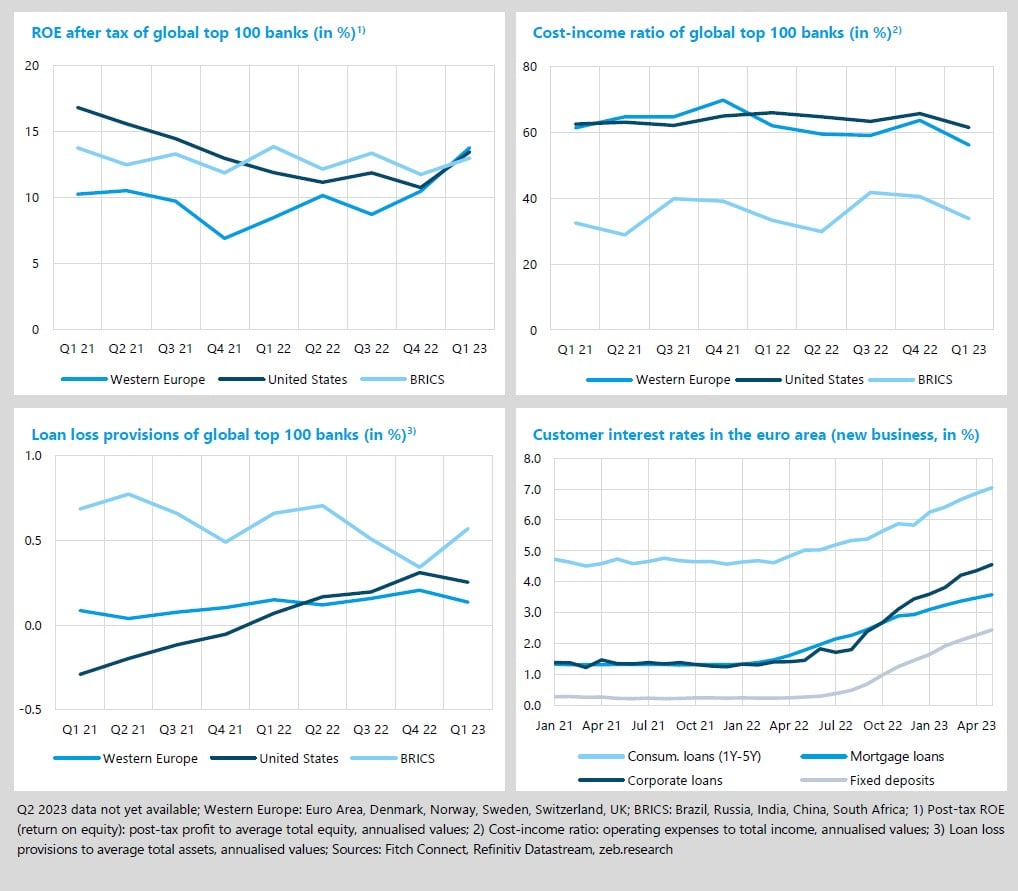
- Western European and U.S. banks reduced their CIR in Q1 23 by -7.5%p and -4.2%p YoY, respectively – both due to considerably higher revenues (Western European banks: +9.3%p YoY, U.S. banks: +16.8%p YoY). While Western European banks also managed to slightly reduce costs (-1.0%p YoY), U.S. banks saw their costs increase in Q1 23 (+8.9%p YoY). Benefiting from falling inflation rates, BRICS banks were able to reduce costs (-3.3%p YoY). However, revenues also declined (-4.8%p YoY), leading to an overall increase in the CIR (+0.5%p YoY).
- After a continuous expansion of loan loss provisions in the previous quarters and in view of the recent steady GDP forecasts, Western European and U.S. banks slightly reduced provisions in Q1 23 (Western Europe: -7bp QoQ, U.S.: -6bp QoQ). BRICS banks, on the other hand, increased provisions by +23bp QoQ after two consecutive quarters of decreasing loan loss provisions.
- The ECB continued its interest rate hikes, with customer rates following accordingly. Corporate loans experienced the strongest increase of +3.1%p YoY to 4.6% by the end of May 2023. Consumer loans exceeded 7.0%, reaching levels last seen before the global financial crisis, while deposits climbed close to 2.5% in May 2023 driven by the ongoing and intense competition among European banks.
Special topic – regulatory gaps between the U.S. and the euro area
- The banking turmoil in March 2023 caused some U.S. banks to fail, while euro area banks remained stable – can these different developments be explained by significant regulatory gaps between the U.S. and the euro area?
- Our detailed comparison reveals existing regulatory gaps between midsized U.S. banks (still large banks by European standards) and euro area banks.
Recent bank failures in the U.S. all caused by liquidity issues due to large-scale deposit-withdrawals and poor (interest rate) risk management led to turmoil in international banking markets. While some banks in the U.S. failed quickly, euro area banks remained remarkably stable – the capital market outperformance of Western European banks (see chapter 1) is reflecting this as well. This raises the question of whether there are structural differences in the regulation of U.S. and euro area banks that explain the different developments. How are the different regulatory frameworks designed? What are the differences regarding capital and liquidity requirements, as well as interest rate risk and overall risk management? Are the regulatory authorities in the U.S. and euro area aware of certain shortcomings and what are the regulatory road maps looking forward?
In both jurisdictions, regulators assign banks to different regulatory categories, which are subject to stricter or rather lenient requirements. The classification is based primarily on the size of a bank in terms of their total assets. Other relevant criteria relate to the complexity, interconnectedness, and economic relevance.
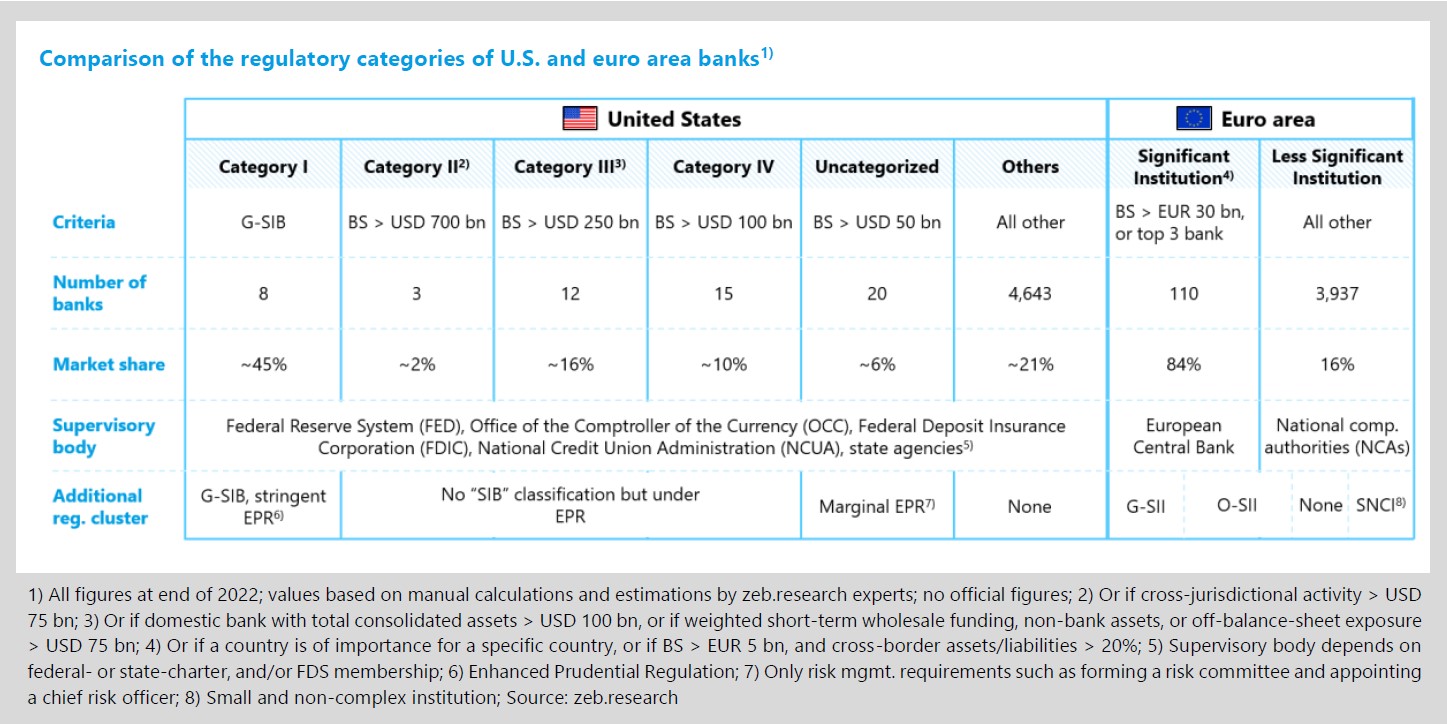
In the U.S. there are six different categories (see the figure above). Banks with total assets larger than USD 100 bn or fulfilling other complexity and interconnectedness criteria belong to Categories I–IV, while Category I is reserved exclusively for globally systemically important banks (G-SIBs). The remaining two Categories are Uncategorised banks (USD 50–100 bn) and Other banks. This rather granular categorisation differs significantly from the euro area, where only two regulatory categories exist: significant institutions (SIs) and less significant institutions (LSIs). Any bank with total assets greater than EUR 30 bn, the three largest banks in a member country or banks fulfilling other complexity and interconnectedness criteria will be classified as SI. All other banks in the euro area are considered LSIs. Globally systemically important institutions (G-SIIs) are just an additional regulatory layer for banks otherwise categorised as SI. In contrast, small and non-complex institutions (SNCI) as part of the LSI cluster gain limited regulatory relief.
As shown in the above figure, the requirements to belong to the most strictly regulated category are comparatively low in the euro area. A midsized U.S. bank from Category III or IV, or even some Uncategorised banks, would already be considered an SI in the euro area. With 4,706 banks and EUR 22,9 tr total assets in the U.S. and 4,047 banks and EUR 30,8 tr total assets in the euro area, the more granular approach by the U.S. is not rooted in a vastly larger banking market (figures as of 2022). In the U.S., 58 banks with a combined market share of around 79% make up the first five categories with the 8 G-SIBs already capturing a market share of around 45%. In the euro area, on the other hand, the 110 SIs have a market share of roughly 84%, which is less remarkable considering the large number of banks classified as SIs.
Another difference between the U.S. and the euro area is the assignment to a supervisory authority based on the regulatory cluster. In the U.S., it is decisive whether a bank is state- or federally-chartered, or whether it is a member of the Federal Reserve System. Accordingly, the prime regulatory body can be the FED, the Office of the Comptroller of the Currency (OCC), the Federal Deposit Insurance Corporation (FDIC), the National Credit Union Administration (NCUA or state agencies. In the euro area, all SIs are supervised by the ECB, while all LSIs are supervised by national supervisory authorities.
The relevance of the classification becomes apparent when considering that all the recently failed banks (Silicon Valley Bank, Signature Bank, and First Republic Bank) have belonged to U.S. Category IV banks. So, what are the differences and potential gaps regarding capital and liquidity requirements, as well as interest rate risk and overall risk management across the different categories and regions?
Some regulatory gaps become already apparent when looking at capital requirements. While the minimum CET1 ratio requirements are the same for all banks in both jurisdictions, significant differences can be observed when considering countercyclical capital buffers (CCyB) and stress buffers. The CCyB forces banks to accumulate capital to strengthen the resilience of the banking sector during periods of stress in dependence of banks’ geographical loan activities. In the U.S., only Category I–III banks potentially have to build up a CCyB, while in the euro area all banks must potentially create a CCyB. In terms of stress buffers, there are also significant differences. While Category I-IV banks must maintain a stress buffer of over 2.5%, this value is lower for Uncategorised and Other banks. In the euro area, the systemic risk buffer consists of the 2.5% standard requirement, the Pillar 2 requirements, the Pillar 2 guidance and the systemic risk buffer for SIs and LSIs. All these additional requirements are set individually for each bank. Overall, the minimum capital requirements in the euro area are substantially higher than in the U.S. – while not necessarily true in comparison to the G-SIBs, surely when compared to U.S. midsized banks. This also explains why the average CET1 ratio of SIs in the euro area is 3-4%p higher than that of U.S. counterparts.
In terms of liquidity requirements, there is no significant regulatory gap with respect to the Basel III leverage ratio. However, this certainly does not apply to the liquidity coverage ratio (LCR) and net stable funding ratio (NSFR). In the U.S. only Category I–II banks are obliged to comply with an LCR/NSFR requirement of 100%. For Category III (85-100%) and Category IV (70-100%) banks, the requirements are already significantly lower, while Uncategorised banks and Others do not have to meet any LCR/NSFR requirement at all. In contrast, euro area banks must comply with the full LCR/NSFR requirement of 100%.
Another regulatory gap presents itself in the interest rate risk management. In the U.S., not a single bank has an IRRBB (interest rate risk in the banking book) disclosure obligation, while in the euro area the IRRBB must be disclosed by SIs at least annually and up to once per year by LSIs. Part of IRRBB disclosers are the results of stress scenarios simulating significant and abrupt changes to yield curves and the corresponding effects on banks. In a world that exhibited an unpredicted historically fast increase in interest rates over the last year (see chapter 2), the importance of such stress scenarios becomes apparent.
Finally, the degree of stringency in establishing risk management requirements varies across jurisdictions. In the U.S. all defined risk management requirements must be implemented by Category I–II banks. Fewer rules apply to Category III banks and significantly fewer rules to Category IV banks. Only marginal risk management requirements apply to Uncategorised banks and none to the 4,643 banks with a market share of around 21% classified as Others. In the euro area, all jurisdiction-specific risk management requirements apply to SIs and fewer rules to the LSIs.
In summary, there are no significant regulatory gaps between the very large banks in the U.S. and the euro area banks. The actual regulatory gaps exist between midsized U.S. banks, which still represent relatively large banks by European standards, and the euro area banks.
In April 2023, U.S. authorities acknowledged structural weaknesses in their approach to proportionality and have taken initial steps to address them. FED and FDIC want to enhance risk identification, for instance, by a reassessment of systemic risk, or by portfolio entrance exams when a bank grows rapidly and swiftly changes between regulatory categories (such as SVB). They also plan to promote resilience, i.e., by giving banks stronger incentives to manage risks effectively and measuring IRRBB. In addition, they want to change their supervisory behaviour by promoting more challenging judgements and being more consequential when findings are identified. They also want to strengthen processes by introducing a simpler yet stronger over-sight, rethinking the tailoring (Categorisation) framework, and hiring more staff.
European supervisors are aware that they may be better positioned and ahead of the curve, but they are also addressing upcoming priorities: they want to improve risk management (i.e., counterparty credit risk, IRRBB, climate risk, …), strengthen governance by improving the functioning of management bodies and take banks’ business models into account in supervisory processes. They will also look more closely at model risks and parameterisation in the management of interest rate risk and liquidity. Contact us for a more detailed analysis and our view on the necessary steps for bank management and supervision.