Generating shareholder value in banking – a heroic task: P/B ratio development of global top 100 banks
Our dataset covers the global top 100 banks by market cap from 26 countries and includes annual data for several banking KPIs as well as macroeconomic and market indicators from 2003 to 2020. Hence, our analysis to date does not include the latest improvements in the banks’ P/B ratios that we observed in 2021, but we will update our dataset as soon as full-year figures for banking KPIs become available.
All data is based on publicly available information that has been prepared in a structured and standardized manner to allow maximum comparability. Macroeconomic variables are collected by country but transformed into bank-specific factors to reflect each bank’s global activities. We use both traditional panel data statistics as well as state-of-the-art machine learning techniques to ensure that preconceived notions (which usually form the basis for panel regressions) are checked against objective data analytics tools, and to squeeze as much information as possible out of the data.
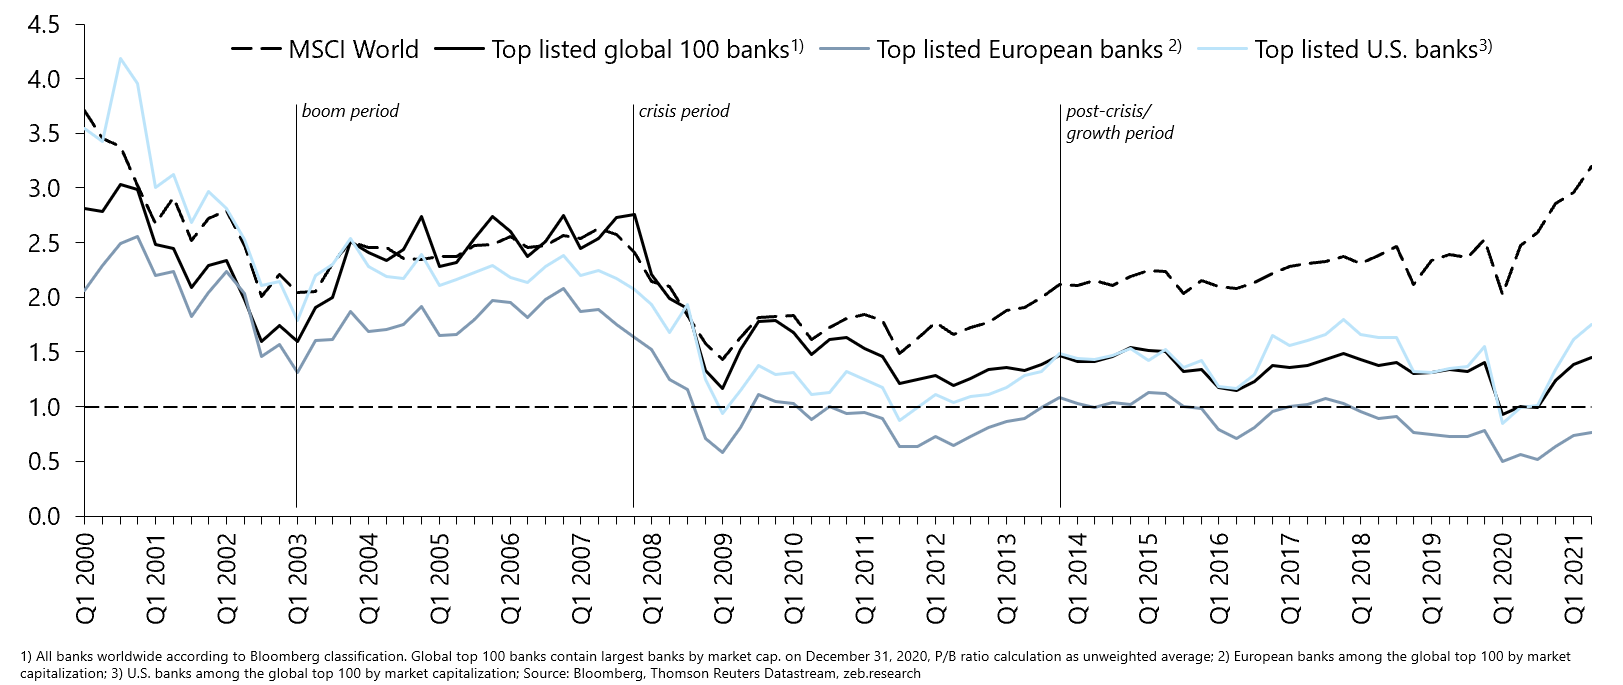 Figure 1: Historic mismatch – P/B ratio development of global top 100 banks vs. market
Our analyses show that some concrete but also complex relationships can be found in the data. Besides some macro-financial conditions, fundamental banking KPIs, focusing on profitability, efficiency and risk, can explain developments in banks’ P/B ratios. The productivity of risk weighted assets (RWA), cost efficiency, and, of course, profitability turn out to be important topics.
However, bank stocks are also still akin to a call option on rising yields, as inflation, a common proxy for potential interest rate movements, is also a relevant parameter in our model. Certainly, our results are still just pieces of a puzzle, but we believe that sophisticated data analytics can at least help to derive informed and (ultimately) better management decisions.
Facts or perceptions? – Modelling and predicting banks’ P/B ratios
In a first step, we build an extensive linear and balanced panel-data model to describe global banks’ P/B ratio developments. As an explanatory variable, we identify a set of 25 potentially relevant parameters in total, which are based on current academic research as well as our own expertise.
The parameters include 18 banking KPIs from profitability, growth, risk and banking model value dimensions, such as return on equity (ROE), return on assets (ROA) and on RWA (RORWA), cost-income ratio (CIR), non-performing loan (NPL) ratio, leverage, growth in total assets or revenues, and RWA density.[1]
The macroeconomic variables include GDP growth, GDP per capita, number of banks per country (as a proxy for the banks’ competitive environment) or inflation (as a proxy for interest rate movements).[2] Based on all variables, a robust model specification with 19 variables is derived by excluding non-relevant variables to avoid biased results.
We use this defined model to analyze the P/B ratios of the global top 100 banks by market cap for the period from 2003 to 2020, also differentiating between boom-and-bust subperiods, i.e. we analyze the periods from 2003 to 2006 (boom period), 2007 to 2013 (crisis period) and 2014 to 2020 (post-crisis / growth period) separately. The results reveal some interesting findings. Although the parameter estimates differ for the individual periods, some variables provide significant values over time: ROA, NPL ratio, RWA density or real GDP growth, all pointing in the economically expected direction.
Other variables, however, seem to just reflect the “zeitgeist” across different periods: ROE or leverage can help explain banks valuations in boom cycles, while a Tier 1 ratio is significant during a crisis period, and the total asset growth variable can be useful in the recent post-crisis / growth period. Furthermore, the explanatory power of our model increases over time, i.e. the model can explain only 22% of the total variation in P/B ratios for the subperiod from 2003 to 2006, but 43% for 2007 to 2013, and nearly 60% for the recent period from 2014 to 2020.
In our analyses, we focus mostly on banks from developed countries. When analyzing banks from emerging markets in our sample, other sets of drivers, such as ROE and real GDP per capita, play a dominant role.
Using traditional regression models can help check for preconceived notions and model linear relationships between data that is known or believed to be known. However, calibrating such models is time-consuming, involves some subjectivity and also requires several robustness checks to make valid statements.
In a second step, we aim to overcome some of these shortcomings and search for further and perhaps unearthed explanations by using supervised machine learning techniques. More precisely, we apply a supervised classification model to our dataset. The purpose of this more scientific, out-of-the-box approach is to obtain accurate predictions based on any given and large enough dataset by utilizing different algorithms to accurately assign the data to specific categories or classes.
Furthermore, it is possible to determine the relative importance of each variable, i.e. the contribution of each explanatory variable to this prediction. Therefore, we classify P/B ratios into values above one and below one and estimate the individual contribution of each variable to the classification of the P/B ratios. Finally, we identify the most important variables of our model, i.e. the variables showing the highest predictive power.
Applying this method to the same dataset and the same subsamples confirms some of our first results. Over time and across regions, both the ROA and NPL ratio but also ROE can be identified as important bank KPIs, i.e. they continuously make a strong contribution to the prediction of the banks’ P/B ratios. Among the economic variables considered, inflation and real GDP growth are generally the most important.
Other variables, such as RORWA, CIR, Tier 1 ratio, total asset growth or liquidity (as deposits plus long-term funding and equity to total assets) also show relatively high importance, although only for certain periods and/or different regions. For the global top 100 banks, for instance, total asset growth and RORWA are among the most important explanatory variables during the crisis and post-crisis periods, but are not relevant for the boom period from 2003 to 2006. The Tier 1 ratio is relatively important during the crisis period (2007 to 2013), while liquidity is relevant in the post-crisis period (2013 to 2020).
Finally, when using those bank KPIs and economic variables to derive predictions of banks’ P/B ratios (in the sample), we were rather surprised by the validity of these predictions. On average we achieved a (classification) accuracy of between 80% to 90%.
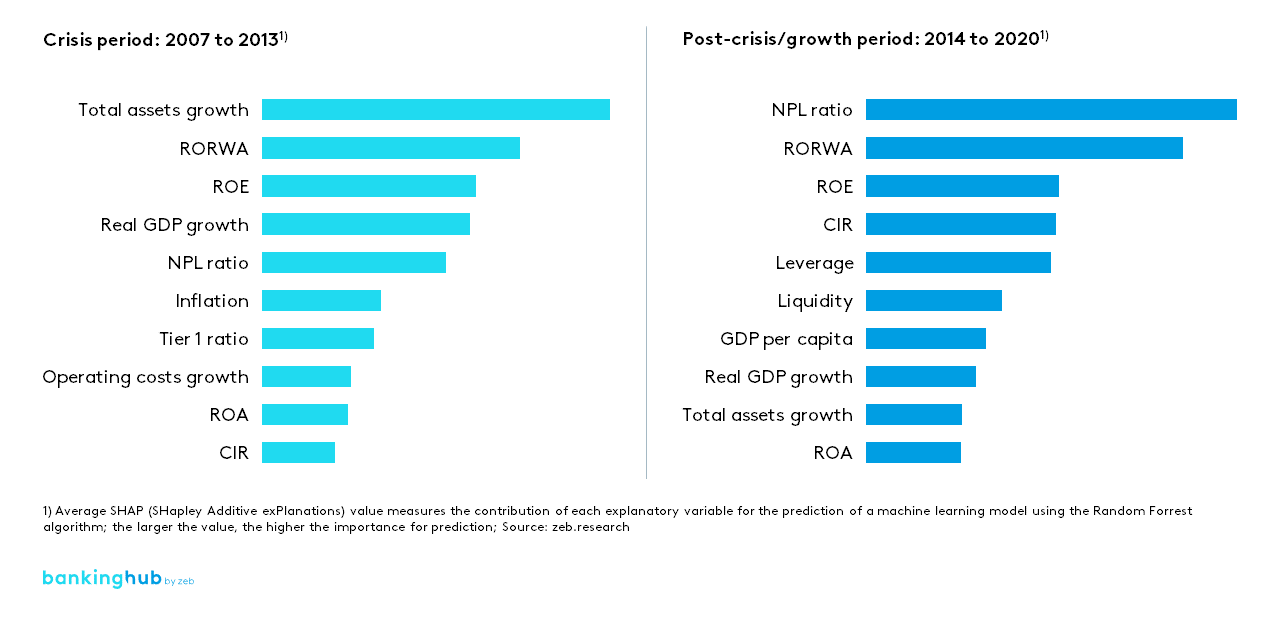 Figure 2: Top 10 explanatory variables for predicting global top 100 banks’ P/B ratios via supervised machine learning
What do our findings mean for analysts and investor relations?
On the whole, we can see that data models and statistics are useful tools to explain and/or predict banks’ P/B ratios. Furthermore, we can conclude that the explanatory power of those models has increased over time, which also reflects the growing relevance of data and data analytics in bank valuation processes.
These relationships, however, are complex and not predefined, therefore it is advisable to use machine learning methods to objectivize the results and build efficient models. The technology available as well as the abundance of data at our disposal allow us to run these analyses continuously. Applying these data-driven procedures should thus be a staple for anyone looking at FSI (stock) performance.
But what do our findings mean for bank managers? Despite the variety of analyses and results, some very interesting conclusions may be drawn:
- Increasing asset or RWA productivity (i.e. balance sheet management) is the most important management topic, and risks must be kept under control – banks need to pick the right deals and counterparties.
- Cost efficiency can only explain part of the P/B ratio and must be aligned with overall higher profitability.
- Inflation, combined with real GDP growth as relevant macroeconomic parameters, indicates that most bank stocks are still akin to a call option on rising yields and are pegged to the performance of the economies in which banks operate. However, the identified relationships may vary over time (as well as region). Therefore, these analyses need to be performed on a regular and differentiated, bank-specific basis to understand all trends and (perhaps) adjust steering/reporting mechanisms accordingly.
So, have we found the crystal ball to explain it all? No, certainly not. We are merely looking at (imperfect) data through different lenses. Do we believe that the analytics will help us arrive at informed and (ultimately) better management decisions? Yes, absolutely. And the cost and effort to run these analyses continuously is actually minimal.
We are more than happy to debate this topic with you and discuss how we may support you.