Key Topics
I. State of the banking industry
- Despite an overall rallying of global stock markets during Q2, global top 100 banks show negative TSR performance (-4.0%), the second lowest among all industry sectors.
- Average banks’ P/B ratios decreased noticeably for all regions (U.S. -0.05x, Europe -0.06x, BRICS -0.12x) while P/B ratio of the global market slightly rose again (+0.03x).
II. Economic environment and key banking drivers
- Economic sentiment deteriorated considerably across all regions—the U.S. shows the sharpest drop due to significantly worse assessments of the current economic situation and expectations.
- The Fed decided on the second rates hike in 2018, leading to the flattest USD LIBOR curve in more than a decade.
- Profitability of global top 100 banks recovered in the first quarter of 2018. In particular, U.S. banks’ average RoE jumped by 4.8pp QOQ reflecting first benefits from higher yields and the enactment of the Tax Cuts & Jobs Act in December 2017.
III. Special topic: Chinese top four banks ICBC, CCB, ABC and BOC—the unknown leaders?
- The Chinese banks are the four largest credit institutions in the world by total assets.
- Driven by the strong Chinese economy, the top four banks show high profitability (RoE between 14.1% (BOC) and 17.3% (ABC) at the end of Q1 2018) and low cost-income ratios (no more than 34.4%).
- However, opaque structures of the Chinese economy and a continuously protected banking market lead to low investors’ confidence and low P/B ratios.
I. State of the banking industry
Despite an overall rallying of global stock markets during Q2 2018, there is still a lack of investors’ confidence in the global banking industry. Global top 100 banks showed the second lowest TSR performance among all industry sectors and market capitalization decreased by 4.1% QOQ. Average banks’ P/B ratios fell noticeably for all regions while the global market’s P/B ratio slightly rose again (+0.03x).
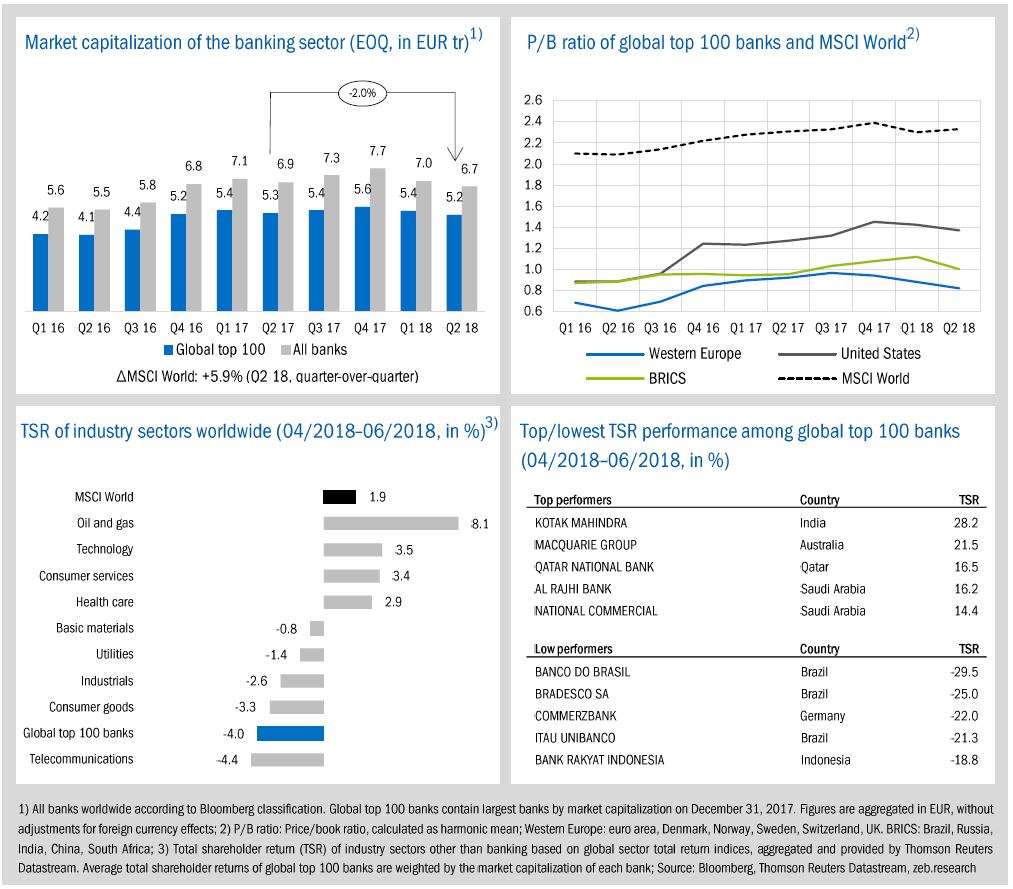
- While global market capitalization increased by +5.9% QOQ (+5.7% YOY), market cap of the banking industry decreased in Q2 2018 for the second time in a row. Global top 100 banks’ value went down by -4.1% QOQ (-2.0% YOY) and all banks’ market cap by -3.2% QOQ (-4.0% YOY), reaching the lowest values for one and a half years.
- Average P/B ratios of European banks continued their downward trend in Q2 (0.82x, -0.06x QOQ), with the 1.0x hurdle becoming increasingly distant. Average banks’ P/B ratios of other regions also declined (U.S. -0.05x, BRICS: -0.12x) and BRICS banks’ average P/B ratio is once again down to the value of 1.0x after three quarters above the hurdle.
- Saudi Arabian banks are once again under the TSR top performers, benefitting from the MSCI decision to upgrade the country to an emerging market. Brazilian banks were unable to hold the strong Q1 gains and are now among the TSR low performers.
II. Economic environment and key banking drivers
In Q2, global economic sentiment deteriorated considerably with the U.S. showing the sharpest drop (-20.2 balance points to 23.9). Apart from that, the Fed decided to increase U.S. interest rates for the second time in 2018, leading to the flattest USD LIBOR curve in over a decade.
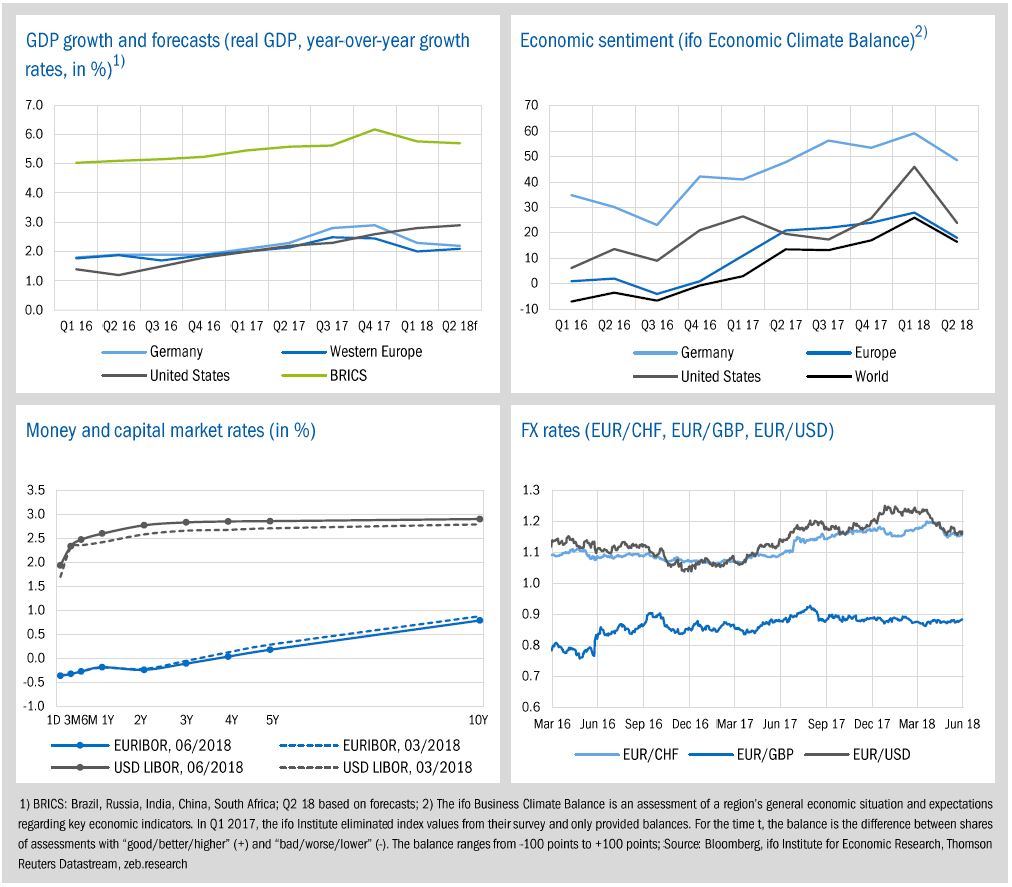
- In Q2, expected economic growth did not change significantly across all regions. GDP growth is expected to increase only in Western Europe and the U.S., but only with subdued rates of +0.1pp, whereas expected growth in BRICS is slowing down further by about -0.1pp.
- The Fed increased U.S. interest rates to 2.0% and also increased the number of planned rate hikes for 2018 from three to four. As a result the spread between 1- and 10-year yields shrank by +6.8bp. The ECB, however, decided to keep interest rates at record lows but will end the QE program in December, leading to a slight downward shift at the long end of the EURIBOR curve.
- After reaching a new 3-year high in Q1 2018, the exchange rate of the euro against the USD dropped down to 1.16 at the end of Q2 (-5.1% QOQ).
The profitability of global top 100 banks recovered in the first quarter of 2018. In particular U.S. banks’ average RoE jumped by +4.8pp QOQ (+2.7pp YOY) to 12.7%, reflecting first benefits from higher yields and the enactment of the Tax Cuts & Jobs Act in December 2017.
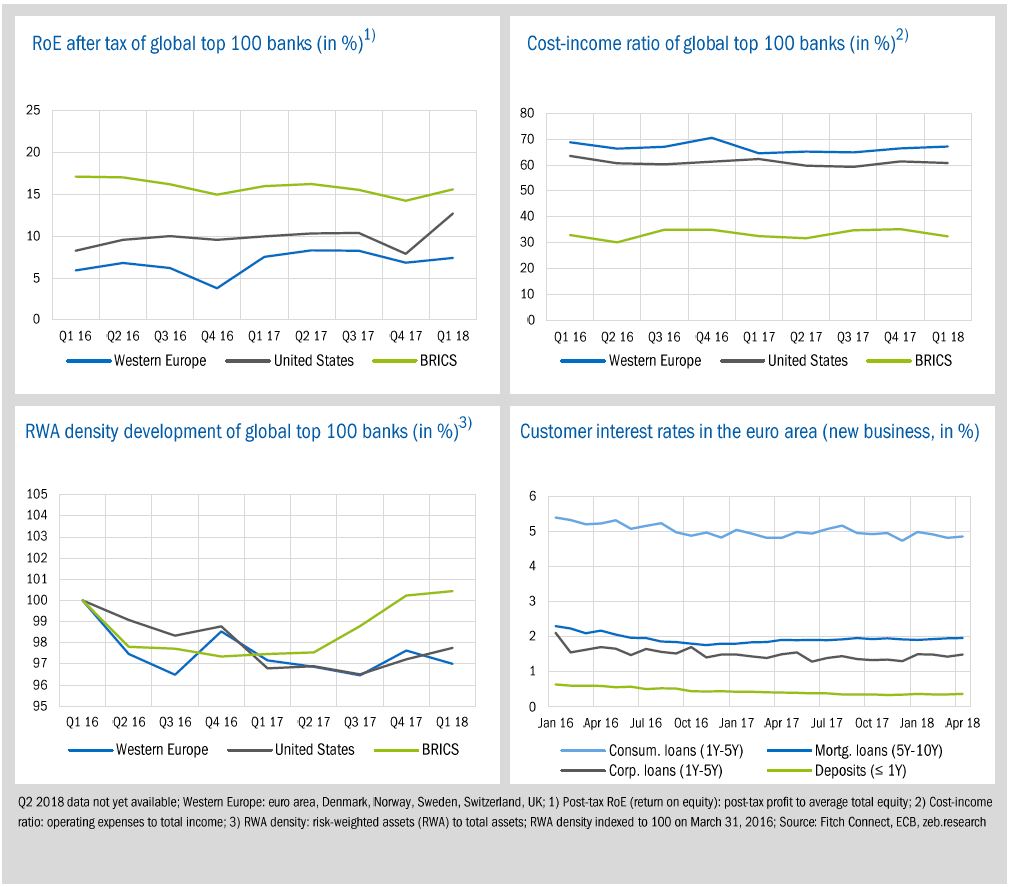
- Compared to previous year’s results, the average post-tax RoE of European and BRICS banks decreased in Q1 2018 (Europe: -0.1pp YOY; BRICS: -0.4pp YOY).
- U.S. banks significantly increased their lead compared to European banks’ profitability. Beside a massive reduction in tax expenses, higher revenues supported U.S. banks’ net income development in Q1. Their pre-tax profit increased by +9.9% QOQ and 1.3% YOY on average (European banks: +3.5 QOQ, -4.0% YOY).
- In Q1, the CIR of European banks increased for the second time in a row to 67.1%, the highest value since Q4 2016.
- BRICS banks’ RWA density has increased continuously since Q4 2016 (+3.1pp in total to 100.4% in Q1), mainly driven by the disproportional RWA growth of several Chinese banks.
- Taking the customer’s view, all customer rates showed a moderate upward trend in the first four months of 2018. Compared to December 2017, corporate loans increased by +0.19pp, consumer loans by +0.12pp, mortgage loans by +0.04pp and deposits by +0.02pp.
III. Special topic
Chinese top four banks ICBC, CCB, ABC and BOC—the unknown leaders?
Chinese banks top the list of the world’s largest banks by total assets.[1] Based on end of 2017 figures, the top of the list is dominated by the big four Chinese banks ICBC, CCB, ABC, and BOC. Also regarding market capitalization, these four banks are listed among the global top 10 banks. Hence, it is worth taking a closer look.
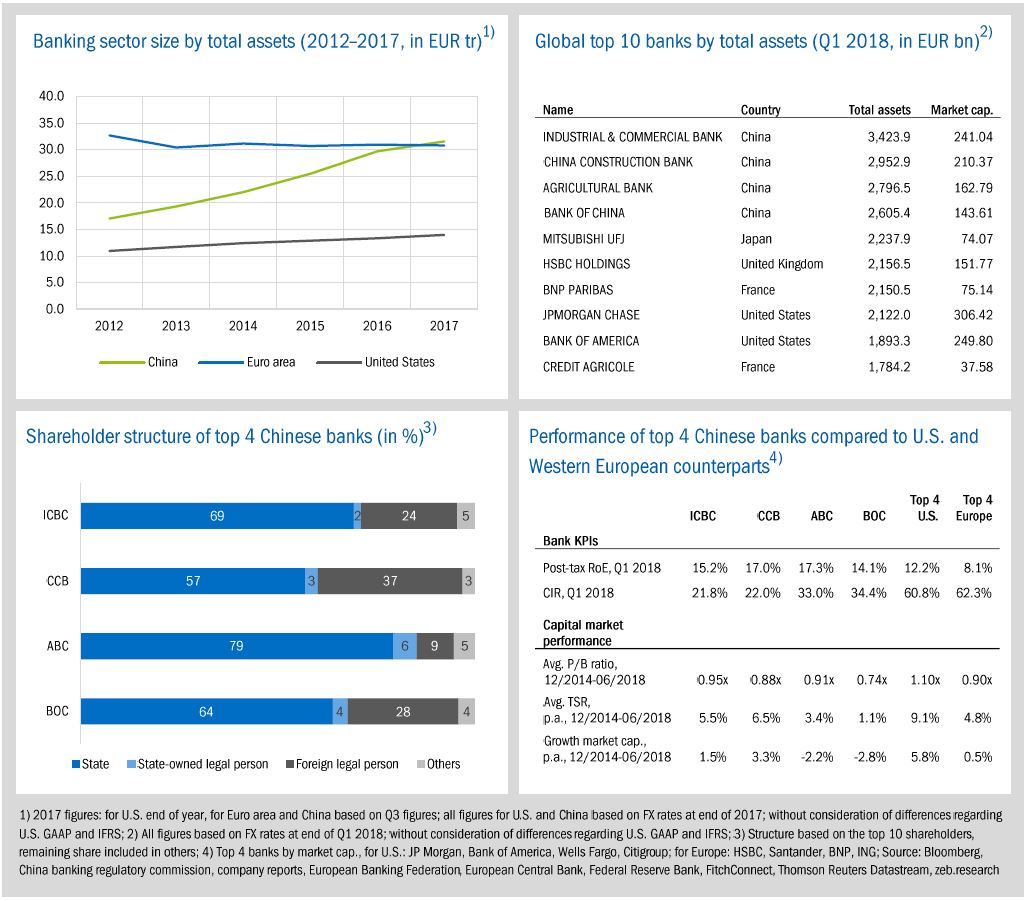
As the second largest economy in the world—closely behind the U.S.—China’s banking sector is already world leading by asset size. With EUR 31.6 tr in total assets, the Chinese banking sector is much larger than the size of U.S. banks’ total assets (EUR 14.0 tr) and, due to an enormous average growth of 13.1% p.a., China also overtook the banking sector of the euro area in 2017 (EUR 30.8 tr). Taking a closer look at the Chinese banking market reveals that it is dominated by four domestic credit institutions: Industrial and Commercial Bank of China (ICBC), China Construction Bank (CCB), Agricultural Bank of China (ABC) and Bank of China (BOC).
Overall, these four Chinese banks account for around 37% of the Chinese banking market, which totaled 4,399 incorporated banking institutions at the end of 2016. Originally, created as state-owned specialized credit institutions, the function of the big four banks was to support private economic activity outside of the planning in different fields—ICBC in the industrial sector, CCB in infrastructure finance, ABC in the agricultural sector and BOC in foreign trade. In line with China’s reform and opening up period, the banking system also underwent major changes during the early 1980s. As a result, the big four evolved from fully state-owned specialized banks to state-controlled commercial banks. Between 2005 and 2010, they were restructured to a joint-stock limited company, listed on both Shanghai and Hong Kong stock exchanges. Despite these IPOs, the government still has the majority interest in these banks—between 60% (CCB) to 85% (ABC) are controlled directly or indirectly by the state or state-owned companies. The largest individual shareholders are the state-owned investment company Central Huijin Investment and the Ministry of Finance.
Starting from different specializations, the business of the banks converged to universal banking models with a similar overall business structure, consisting of three main segments: corporate banking, personal banking and treasury. The strongest focus is on the corporate banking segment—44% for CCB to 49% for ICBC, based on segment revenues to total revenues—which includes financial products and services to corporations, government agencies and financial institutions. Personal banking describes the second largest segment—31% for BOC to 39% for CCB—which provides financial products and services to individual customers, including personal loans, deposit products, card business and personal wealth management. Treasury comprises 11% to 14% of the banks’ business. Regarding their regional presence, all banks are focused on the domestic market. ABC and CCB have almost all of their business in mainland China (ABC: 96%, CCB: 93%). BOC and ICBC have just 74% and 87% domestic business and therefore a larger international presence where the remaining part is allocated to branches and subsidiaries in other Asian countries but also Europe as well as the Americas.
Regarding profitability and efficiency, the big four Chinese banks also show top values. With RoE figures between 14.1% (BOC) and 17.3% (ABC) at the end of Q1 2018, the top four Chinese banks significantly outperformed their European counterparts (8.1%) as well as the top four U.S. banks (12.2%). Furthermore, the Chinese banks have cost-income ratios of no more than 34.4% and therefore nearly half the average values of the top U.S. and European banks. However, looking at capital market performance, the picture is very much different and the top four Chinese banks are far behind the top four U.S. institutions and just on a similar level as the European top banks. Especially the average P/B ratios are below the important hurdle of 1.0x.
Although the growth of the Chinese banking sector as well as the good KPIs of the top Chinese banks seem appealing, this does not seem to convince investors. Despite several steps towards an opening of the Chinese economy as well as the financial system, the banking sector is still strongly protected. Up to now, foreign investors are only allowed minority shareholdings in Chinese banks, which limits the possibility to take significant influence—this is particularly valid for the big four state-controlled banks. Furthermore, the enormous growth of China’s banks is based to a high degree on an enormous loan growth. For the Chinese big four, since 2012, average yearly loan growth was around 10% p.a., which also increases credit risks. Total debt of government, corporates and households as a percentage of GDP increased by around 50pp since 2012, exceeding 255% of GDP at the end of 2017. The critical factor here is the massive corporate debt of 160% of GDP, including a considerable share allocated to state-owned “zombie enterprises”. Moreover, a significant part of debt is financed by the non-regulated shadow banking industry. Finally, increasing NPL ratios—from 0.95% in 2012 to 1.74% in 2017 (see zeb.market.flash #25)—and doubts about stable long-term economic growth in China increases investors’ concerns regarding the real extent of credit risk within banks’ balance sheets.
Overall, opaque structures of the Chinese economy and the, to some extent, still protected banking market also weaken investors’ confidence in the big four Chinese banks. Even if regulation regarding shadow banking has recently been tightening in China, the evolving financial system does not yet stand on solid and independent ground. However, with the further opening of the Chinese economy as well as a growing global engagement of Chinese enterprises, the big four banks will also increase their activities abroad. The old players from the U.S. and Europe need to observe carefully whether the world’s largest banks from China will also be able to become serious competitors on a global scale.