SREP requires comparisons with competitors
In the SREP guidelines, the EBA states that the supervisory authorities need to assess a bank’s business model and risk position in strategic and quantitative terms. In this assessment, the bank must also be evaluated in comparison to its competitors (its so-called peer group).
It is clear from previous experience in on-site inspections that the supervisory authorities also expect the banks themselves to regularly take a critical look at their financial and risk figures in comparison with their competitors. The management of a bank is expected to “know” its competitors and to be able to classify the position of its own bank among the peer group from different perspectives (e.g., from a financial perspective and a risk perspective).
Success factors for holistic benchmark analyses
In zeb‘s view, three success factors are crucial for peer group comparisons:
1. Up-to-date and harmonized information base
A peer group comparison requires the same information and data on the same reference dates for all banks of the peer group. Banks that want to compare themselves to their competitors face the challenge of collecting uniform data about the entire peer group and as quickly as possible.
It seems obvious to use information for comparisons with competitors that is publicly available for all banks. Banks are obliged to publish their annual reports (or quarterly reports, where applicable) and to publish a disclosure report once a year. From these publicly available reports, balance sheet and profit and loss data as well as selected information on regulatory indicators can be obtained.
Additionally, data from annual reports and disclosure reports refer to uniform reporting dates (usually December 31), so that these records can also be compared over time. Data from annual accounts and disclosure reports are uniformly structured and processed. The uniform structure allows the use of electronic solutions, so that data collection can be automated or partially automated. In the exemplary solution approach presented here, annual financial statement data is automatically loaded into the database for peer group comparison via an interface shortly after publication.
2. Flexible composition of the peer group and analysis period
The competition analyses should take various criteria or perspectives into account:
- Business model: How does the bank compare to banks with similar business models?
- Market segments: In which market segments and in which sizes does the bank differ from competitors?
- Business region: How is the bank positioned compared to banks in the same region?
- No group or association boundaries: How does one’s own bank compare with competitors outside the group or association structures?
- etc.
For a targeted analysis, the peer group must be composed individually for each institution. In other words, it should be possible to change the peer group depending on the focus of the analysis. Moreover, the analyses should not be limited to individual dates – such as the last financial year or the last annual accounts. In order to assess longer-term trends and developments, various analysis and comparison dates must be considered.
Figure 1 shows an example of a solution approach for defining the respective peer group and for determining the analysis dates.
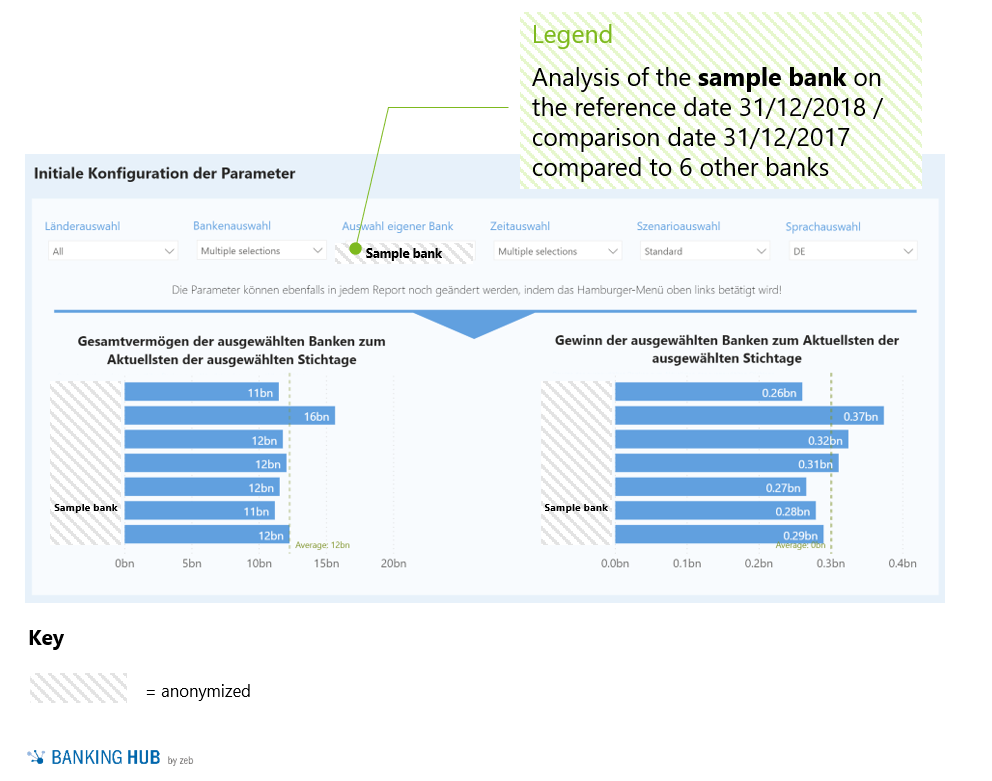 Figure 1: Definition of the individual peer group and analysis dates (exemplary)
3. Comparisons with competitors at various levels of detail on the basis of uniformly calculated key figures
Key performance indicators (KPIs) for assessing the financial and risk situation must be calculated uniformly from the annual financial statement and disclosure data collected for analysis dates. The uniform calculation of KPIs on the basis of a harmonized database (see explanations on point 1 above) allows an objective comparison of the indicators among peers. A collection of figures from annual financial statements calculated individually for each institution cannot guarantee this objectivity because figures are often calculated according to different KPI definitions.
Ideally, the starting point of the analysis is an overarching look at one’s own bank in comparison to competitors. For this purpose, highly aggregated KPIs should be used, allowing an initial assessment of the institution and its competitors from different perspectives (financial situation, risk situation, etc.).
In the solution approach presented, the analysis and identification of the bank’s own strengths and weaknesses is visually supported in a so-called dashboard. For defined top KPIs, the absolute and relative positioning of the own bank within the peer group can be clearly seen in a dashboard, e.g. through deviation analyses of minimum, maximum and the top 25 of the peer group (for an example see Figure 2).
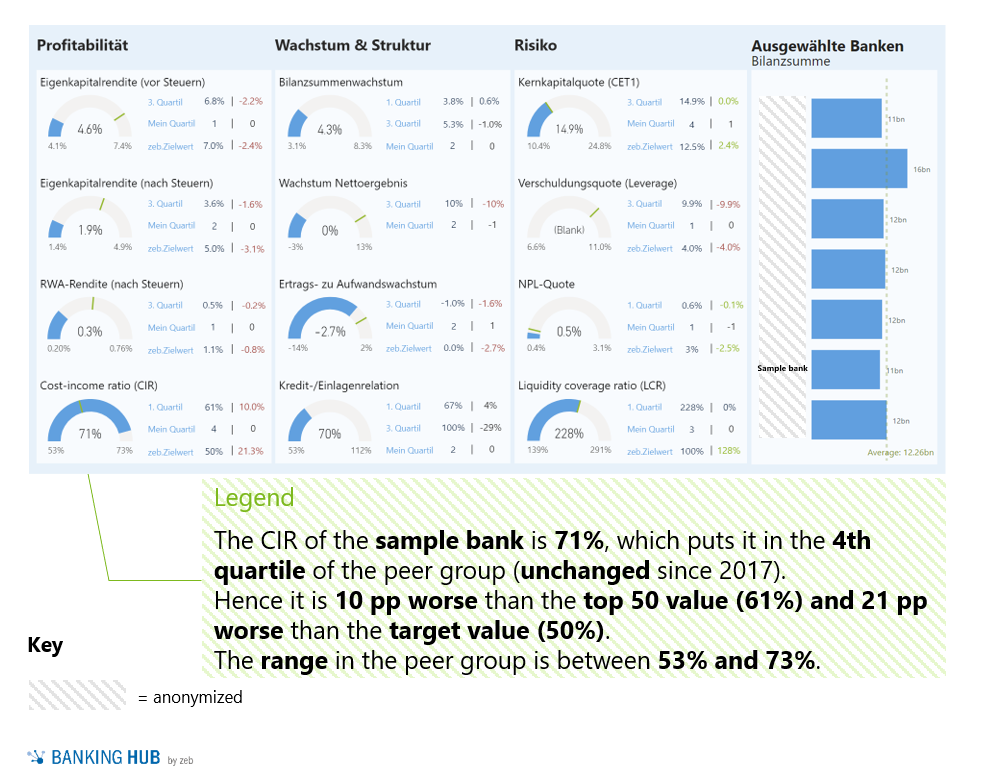 Figure 2: Exemplary dashboard for key financial and risk KPIs
Following the highly aggregated view in the dashboard, detailed analyses can be combined in order to gain deeper insights:
- For this purpose, it is possible to perform drill-downs of the top KPIs of the dashboard to the individual values of the competitors in the peer group (see the example in Figure 3).
- In addition to trend analyses over time, cause-and-effect relationships can be identified even on the level of individual balance sheet items, P&L items or risk positions using value driver trees (see exemplary figure 4) or structural analyses.
Benchmark analyses also have economic value
Analyses and comparisons with various levels of detail and also over various periods help to identify optimization potentials. The results of such a benchmark analysis required by the supervisory authorities can thus also provide highly valuable insights from an economic perspective.
In the current market and competitive environment, the need for a sustainable improvement in the earnings situation of credit institutions remains. The findings from the competitive comparison can be used as a basis for deriving approaches for operational optimization. But they can also be triggers for management to rethink their own strategies and business plans based on objective figures.
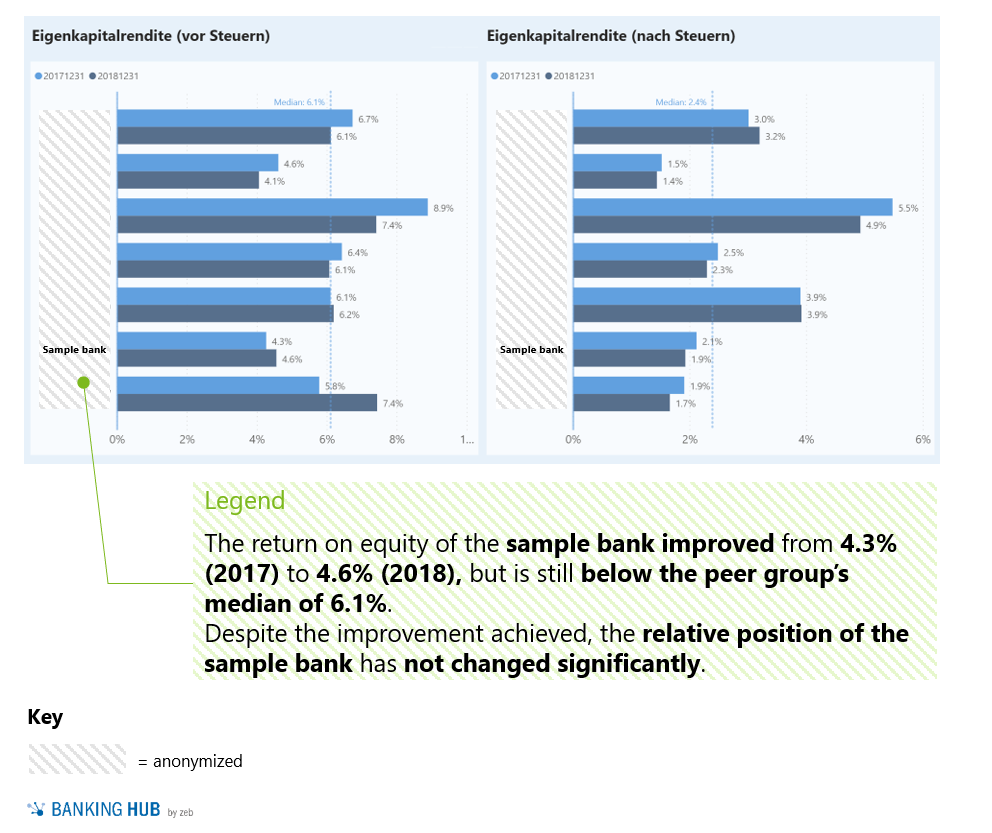 Figure 3: Peer group comparison for return on equity (exemplary)
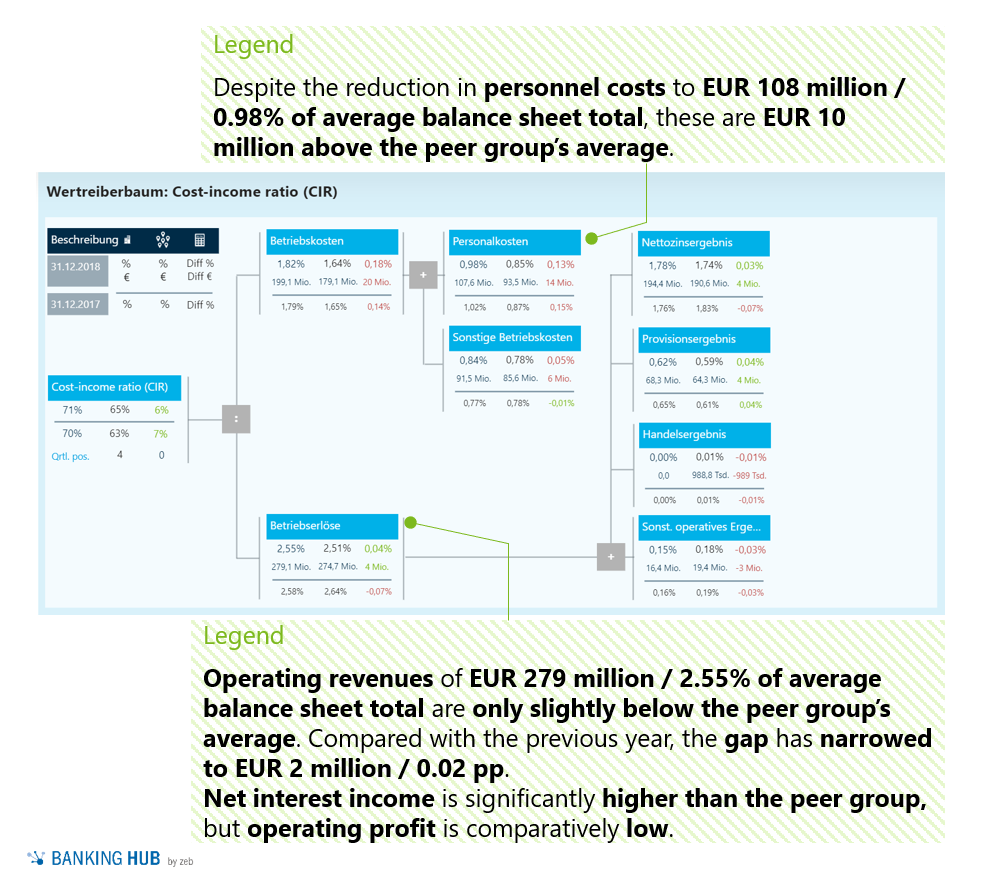 Figure 4: Value driver tree for cost-income-ratio (exemplary)
A holistic approach available as Software-as-a-Service
zeb has developed a Software-as-a-Service offering for a compact but in-depth analysis of key financial and risk figures. This service is available to our customers via the Digital Services Hub directly on the Internet and takes full account of the technical requirements presented.
On request, we will be happy to provide you with detailed information on the scope of our services as well as a temporary test login to our service. Please contact us under benchmarking@zeb-consulting.com.