Rising markets despite ongoing concerns
- In Q4 25, global capital markets recorded moderate price gains (MSCI World market cap +3.2% QoQ) despite pronounced uncertainty factors; the top 100 banks increased their market capitalization to EUR 8.8 trillion, thus ending a very successful 2025 with a new record high.
- Western European banks once again outperformed their US competitors (TSR: +14.5% QoQ vs. +7.9% QoQ), further narrowing the historical valuation gap (P/B ratio +0.16x QoQ vs. +0.14x QoQ).
Strong results even as interest rate tailwinds ease
- Germany continued to tread water in Q3 25 with a growth figure of +0.3% YoY; Western Europe, however, once again exceeded expectations with +1.4% YoY while the US economy also proved robust (US: +2.3% YoY).
- The global top 100 banks achieved strong results in Q3 25 too; with a return on equity of 14.2%, US banks once again took the lead ahead of Western Europe (ROE 13.1%).
- Looking ahead, interest income is becoming less important as a growth driver now that the interest rate turnaround is completed; a sustainable growth story requires higher commission income, systematic cost management, efficiency gains and the strategic use of surplus capital.
Year-end rally of the global top 100 banks
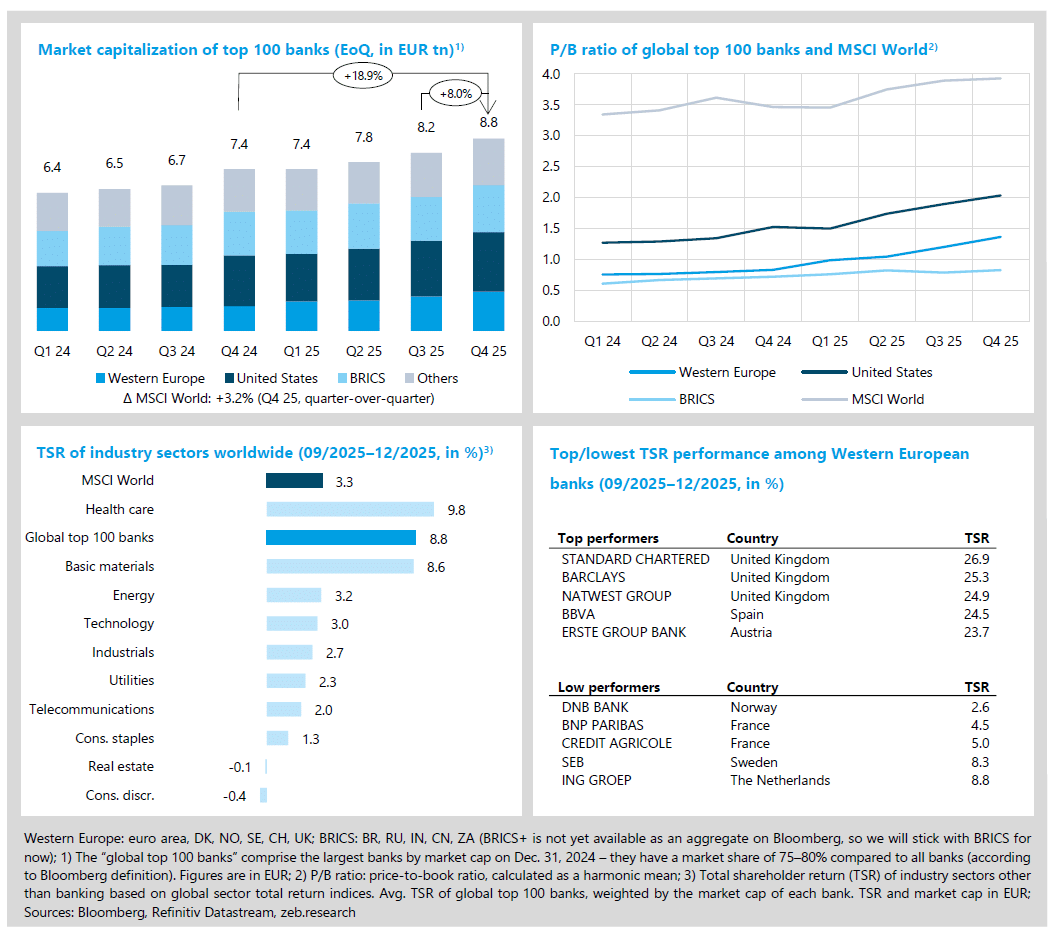
The global capital markets ended Q4 2025 with moderate gains (MSCI World market cap. +3.2% QoQ). Despite pronounced uncertainty factors – including the longest government shutdown in US history and poor consumer sentiment in Europe and the US – the markets proved resilient. In contrast to previous quarters, performance was driven less by technology stocks and more by defensive industries such as healthcare (TSR +9.8% QoQ), but also the global top 100 banks (TSR +8.8% QoQ). Western European banks once again outperformed their US competitors (TSR +14.5% QoQ vs. +7.9% QoQ). The main drivers of the relative outperformance were above all increased share buybacks, a more favorable macroeconomic environment and structurally higher re-rating potential due to the historic valuation gap, which continued to close.
- In Q4 25, Western European and US banks continued their record-breaking growth path in terms of price-to-book ratio (+0.16x QoQ to 1.36x and +0.14x QoQ to 2.03x). Among the Western European banks, two Spanish institutions, BBVA and Caixabank, led the field with price-to-book ratios of 2.07x and 2.02x. Crédit Agricole takes last place with 75x.
- Among the sectors, healthcare is in front with a TSR performance of +9.8% QoQ, supported by catch-up effects and a more defensive positioning of the market players. The top 100 banks follow with +8.8% QoQ– buoyed by significant share buybacks, among other things.
- Three UK banks, Standard Chartered, Barclays and NatWest, were among the TSR top performers– supported by substantial share buybacks. After the failed Sabadell takeover, BBVA also showed an impressive performance with record buybacks and interim dividends. BNP Paribas and Crédit Agricole were among the low performers against a backdrop of French fiscal uncertainty.
Top 100 banks show high profitability in a challenging market
With a growth rate of +0.3% YoY, Germany effectively stood still in Q3 2025. A slight recovery is expected for 2026, supported by increased public investment, among other things, but weak foreign demand and dampened industrial investment will continue to act as a brake. In Western Europe, the moderate growth path continued: Q3 saw +1.4% YoY and was thus better than expected, although industrial momentum remained subdued. The US grew by +2.3% YoY in Q3, with growth driven by continued high investment in tech and AI companies, while investment outside the technology sector has recently declined several times. The US attack on Venezuela has further increased the already high level of global uncertainty; at the same time, additional escalation scenarios are possible, which could have even more far-reaching consequences.
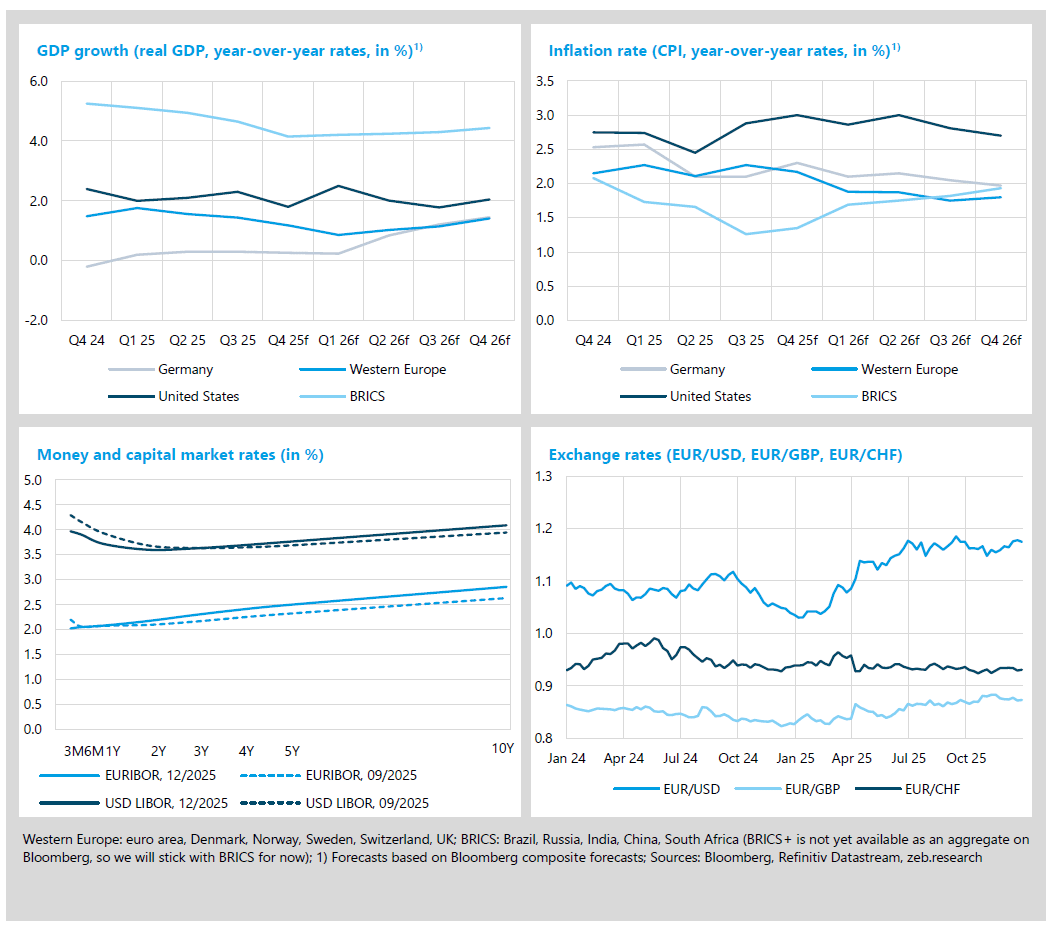
- In Western Europe, inflation was 3% YoY in Q3 25 but is likely to fall below the central bank target of 2% again for the first time in Q1 26 – mainly due to energy base effects. In the US, however, inflation remains stubborn; analysts again expect figures well above 2% for 2026, with high tariffs, among other things, continuing to put pressure on prices.
- The yield curves steepened again towards the end of the year: in the euro area, the 10Y-3M spread rose from 43bp to 83 bp, and in the US from -35 bp to +12 bp, thus returning to positive figures for the first time; nevertheless, the US curve remained inverse in the short to medium term.
- At the beginning of Q4 25, diminishing expectations of Fed interest rate cuts supported the US dollar and thus depressed the EUR/USD exchange rate; following a change in sentiment, the Fed however cut interest rates in early December, while the ECB left its key interest rate unchanged – as a consequence, the interest spread shifted in favor of the euro.
The US banks regained the top position in terms of return on equity (ROE 14.2%) in Q3. The increase in earnings in the US was primarily driven by strong growth in net interest income and decreasing risk provisions, whereby the latter was significantly influenced by an M&A-related one-off effect in connection with the Discover Financial takeover by Capital One which took place in the previous quarter. In Western Europe, profitability fell slightly (ROE -0.8% QoQ to 13.1%) and the net result fell by -4.2% QoQ but remained at a high level. Robust interest income is expected in the new, stabilized interest rate environment, but beyond that it only offers moderate growth potential; a sustainable growth and profitability story requires higher commission income, systematic cost management and efficiency measures as key levers to increase profitability and efficiency.
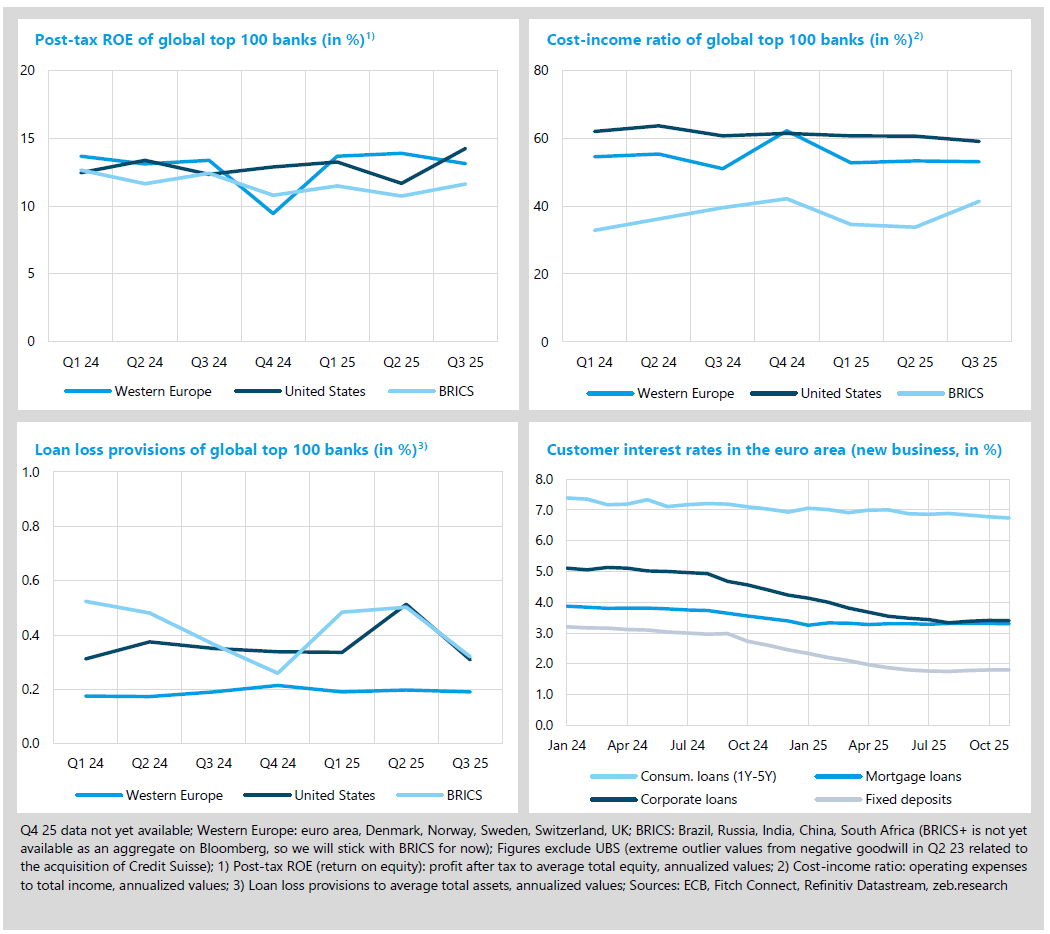
- In Western Europe, the cost-income ratio (CIR) improved slightly by -0.2 pp QoQ to 1%. Although income fell by -1.7% QoQ in Q3, costs fell more sharply (-2.2% QoQ), resulting in a marginal improvement in CIR. In the US, the cost-income ratio fell more significantly from 60.7% to 59.1% (-1.6 pp QoQ), driven by earnings growth (+5.5% QoQ) at moderately rising costs (+2.7% QoQ).
- Risk provisions fell significantly in the US from Q2 to Q3 (-20 bp QoQ), as the M&A-related special effect from the previous quarter’s Capital One / Discovery transaction faded out. At Western European banks, risk provisions continue to oscillate around a moderate level of approx. 0.2% in relation to average total assets (Q3 25: 0,19%).
- In Q3 25, interest rates for consumer loans (1–5 years) fell noticeably (from 9% in June to 6.7% in November), reflecting a moderate and delayed pass-through of the ECB interest rate cut from June 2025.