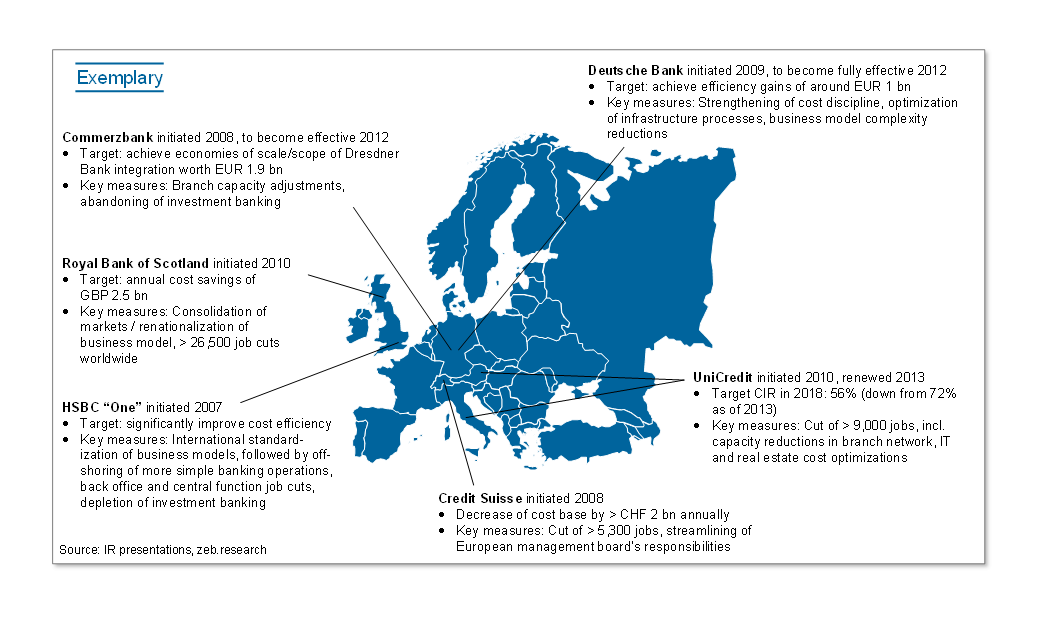
 Figure 1: Cost-cutting and restructuring programs of selected European banks launched from 2007 to 2010
Though many of those programs were quite ambitious, we observe that in practice they often have not delivered efficiency gains in a sustainable, long-term way. That is, relative to the development of income or assets, costs have started increasing after a while.
Apart from this “case example”-like evidence it remains unclear how the total industry’s efficiency has in general developed over recent years. Are there specific types of financial institutions or specific country-clusters that have managed to achieve more income or handle larger business volumes with fewer resources despite the financial crisis? And which types of banks outperform the industry as of today?
Based on a comprehensive data set drawing data from the largest banks from 13 European country clusters, we have analyzed these questions distinguishing between geographical business focuses and business models (n=141). We have covered the years 2007–2014, aware of the fact that the financial crisis has of course had a significant impact on the respective P&L statements[1]. We define efficiency in a simple but apt manner by comparing the development of net banking income and/or business volumes (“output”) relative to the development of total administrative expenditures (“input”) hereby correcting for country-specific inflation rates to prevent skewing our results.
Overall, poor performance of the industry
We begin with a look at the total industry’s performance, see Figure 2. Since 2007, total net banking income increased by just 4% compared to 2014, while at the same time expenditures went up by approx. 20%. That is, (almost) continuously increasing expenditures, especially non personnel-related expenditures, had a sharp impact on profitability: net operating profit was 30% lower in 2014 compared to 2007, while the return on equity turned to zero. In 2014, total personnel expenditures were approx. 10% higher compared to 2007, while non-personnel expenditures increased by more than 35%. In the crisis’ peak year 2008 the cost-income ratio went up to 75%, hereafter stabilizing to a still rather poor level of around 65% until very recently. The expenditure margin as an exception actually improved after 2008 to a relatively stable level of 1.4% from 2010 onwards as business volumes also increased.
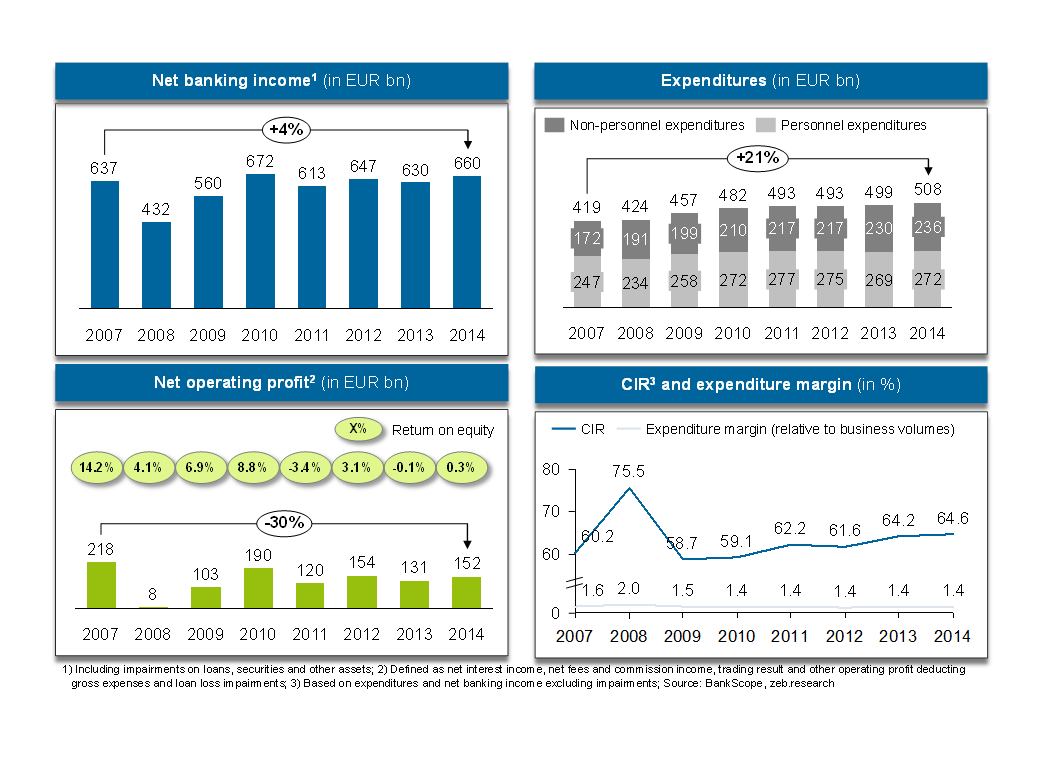 Figure 2: Development of net banking income, expenditures, net operating profit, CIR and expenditure margins, 2007–2014, figures corrected for inflation
Only banks from Switzerland achieved modest efficiency gains
Figure 3 compares the average annual growth rates of net banking income and gross expenditures between 2007 and 2014 on a country cluster level. The proportionality line divides the “winners” in efficiency from the “losers”. Only Swiss banks have achieved gains in efficiency—albeit very modest ones. The majority of countries experienced efficiency decreases (sometimes severe): first and foremost those countries that have been hit hardest by the financial crises like Italy, Spain, Portugal, and in particular Greece, Malta, Cyprus (“Other EU”). But also the growing economies of Russia, Turkey, Ukraine and CEE could not accelerate growth in income relative to the pace of expenditures increases. Slightly worse but in total “almost unchanged” in terms of their efficiency performance are the Northern European countries or regions such as BeNeLux, France, UK, Germany and the Nordics.
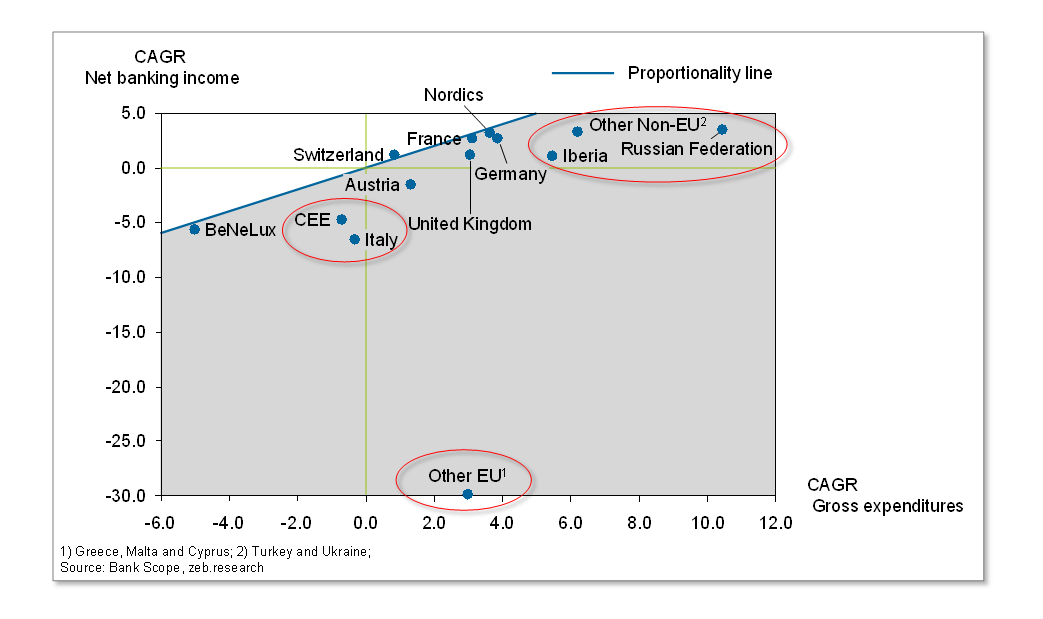 Figure 3: CAGR net banking income and gross expenditures, 2007–2014, in %
To put these findings into perspective, Figure 4 provides two efficiency KPIs that reflect the unchanged view as of 2014: In terms of both favorable cost income ratio and expenditure margins, it is the Iberian and especially the Nordic countries that lead the ranking with well-above average results. From this perspective, Swiss banks are closer to the end of the performance ranking rather than at the top; this is also the case for UK and Austrian banks.
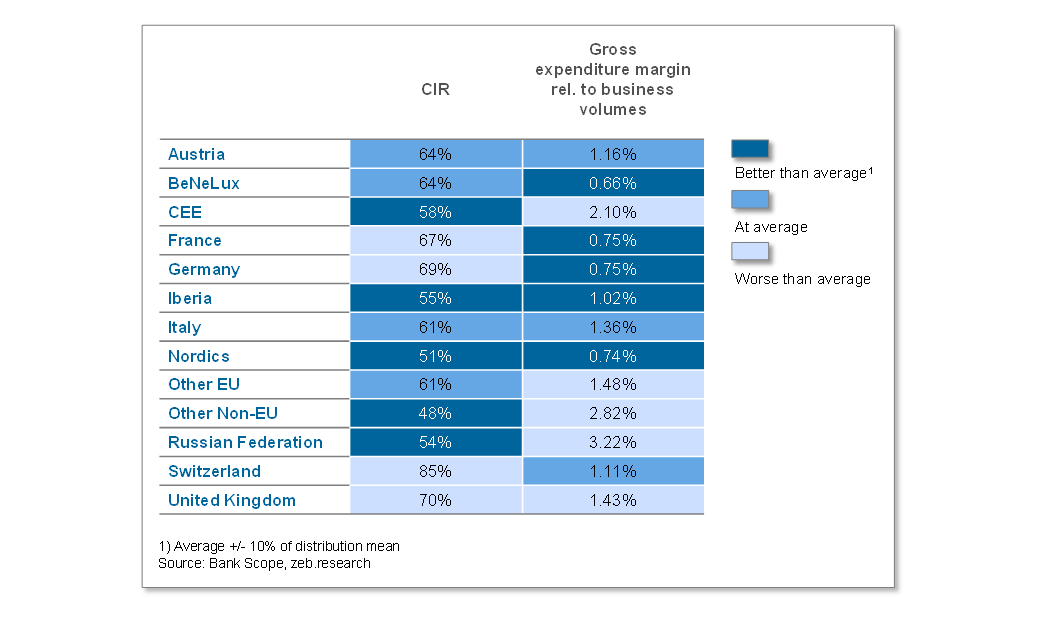 Figure 4: Comparison of CIR and gross expenditure margin (relative to business volumes) by country level, 2014
No business model shining
Taking a look at different business models, an unfavorable picture prevails: As shown in Figure 5, all banks except for wholesale institutions have seen (sometimes significant) decreases in efficiency. Interestingly, specialized financial institutions (“Other”) performed even poorer than retail and universal banks with highly disproportionate increases in expenditures relative to income.
In the unchanged view as of 2014, this view can be qualified, see Figure 6. Obviously, the performance of specialized institutions has deteriorated over recent years, still beating the efficiency of all other business models as of today.
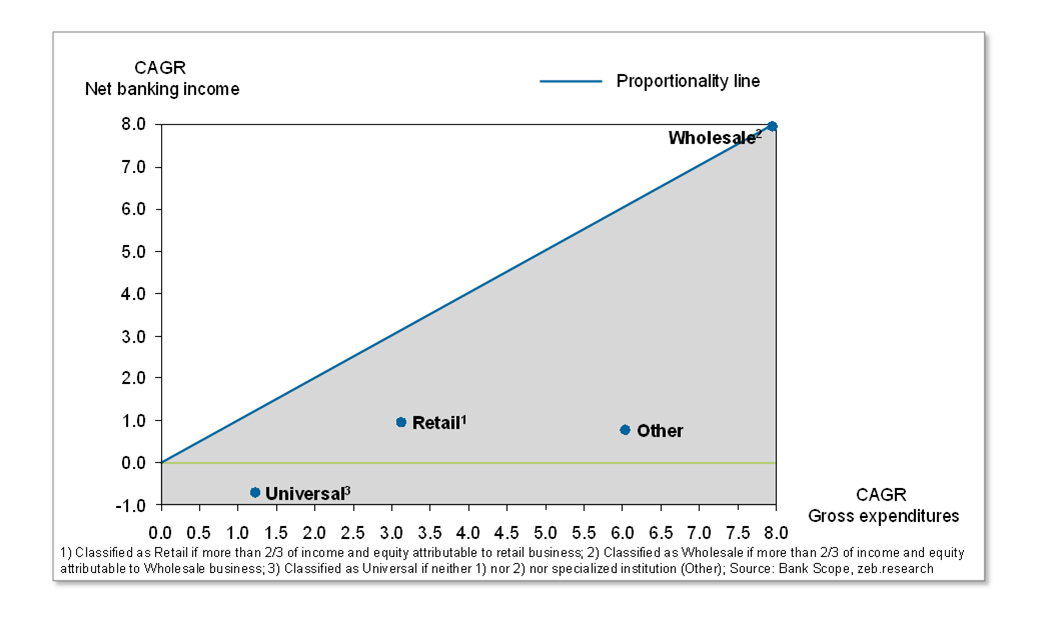 Figure 5: CAGR net banking income (NBI) and gross expenditures, 2007–2014, in %
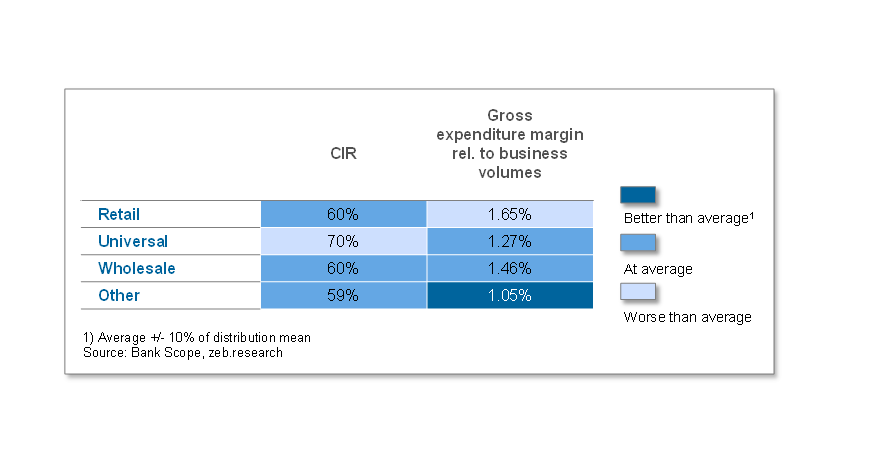 Figure 6: Comparison of CIR and gross expenditure margin (relative to business volumes) by business cluster, 2014
Considerable need for action across the industry
In terms of efficiency, we could not identify a single unanimous “winner” among the suggested groupings—neither within the country clusters nor within the business models. This, however, comes as no real surprise: We have observed that the momentum of large scale efficiency or restructuring programs rarely lasts longer than three years. Already in the third year,
- cost-cutting measures and budget discipline start being diluted: First cases of budget overruns persuade other cost centers to become less strict,
- attention is gradually shifted towards growth: Higher investments are made than formerly planned in the restructuring case, based on the argument that one has to react to the dynamics of the business environment, and
- budgets for regulatory topics grow significantly: Safeguarding regulatory compliance and establishing a (too) large buffer to withstand regulatory pressure is strictly prioritized against any other business goal.
However, fundamental parameters have now changed: The pressure on the income side these days due to low yields and the regulatory imperative to strengthen the capital base (when raising money on the capital market is rather challenging in times of poor profitability) leave European institutions no other option than to finally tackle the expenditures side of their P&L—and to avoid another “lost decade” in terms of efficiency.
And yes, though not visible in our groupings, there are selected institutions that have managed to move their income and expenses in the “right direction”. What can we learn from them? From our data set, we observe that these institutions often pursue a dedicated market strategy by concentrating their business activities to a single region or similar regional clusters (for example, Scandinavia or BeNeLux). Take for instance the Swedish institution SEB AB, one of the few “winners” in efficiency among the universal banks. In terms of its assets, SEB is a comparatively small universal bank and has a clear business focus in Scandinavia, the Baltic countries and selected other European countries (including Germany). It thus operates in relatively homogenous regulatory regimes and markets, which are good preconditions for keeping expenditures low in times of increasing, nationally differing regulatory requirements and highly specialized market offerings. In this way, SEB’s comparatively low business complexity is likely to be an important factor for its successful cost management. SEB’s cost management has three further apt characteristics: Firstly, SEB pursues clear principles (such as strict and decreasing total cost caps for the years 2010 to 2016), secondly, they follow a prioritization of investments towards efficiency-contributing measures (such as few, selected IT solutions). Finally, there are continuous optimizations on the organizational side (such as the centralization of support functions).
But even with broader business models or historically grown complex operating models, there are success factors and best practice approaches which lead to a better efficiency performance. These include:
- strict and formal approaches: Annual top-down cost planning,
- high transparency: Regular external cost benchmarking with the relevant peer group, and
- clear responsibilities for expenditures:
- process-oriented allocation of costs (enabling a fair mapping of expenses to responsible business units), or
- a holistic cost governance approach by a matrix view with both cost center and cost category accounting.
In summary, there are ways out of the “efficiency dilemma” that has caught most of the European financial institutions in recent years. And in times of poor income, managing costs properly becomes more urgent every quarter.